In short
Bangladesh’s export garment industry took off in 1978, when Reaz Garments shipped shirts to France and Desh Garments signed with Daewoo. Helped by quotas, Korean training, duty-free bonded warehouses and back-to-back credit, exports peaked at US$42.6 billion in FY2021-22, a figure Sadiq Ahmed argues was overstated, and were US$38.7 billion, 80.6% of all exports, in FY2025-26.
Want a costing for your own style? Send us your enquiry
Key dates
The table lists the turning points covered below, each with its source. Bangladesh’s fiscal year (FY) runs from July to June, so FY1990-91 means July 1990 to June 1991.
| Date | Event | Source |
|---|---|---|
| About 1960 | Mohammad Reazuddin opens Reaz Store in Chawkbazar, Dhaka; it is renamed Reaz Garments Ltd in 1973 | Sadiqur Rahman 2021; Yunus and Yamagata 2012, 3 |
| 1972 | President’s Order No. 27 nationalises large industrial enterprises | Bangladesh 1972; Yunus and Yamagata 2012, 4 |
| 1974 | The Multi-Fibre Arrangement on textile and clothing trade begins | Yunus and Yamagata 2012, 6 |
| 1978 | Desh Garments signs a five-year collaboration agreement with Daewoo of South Korea (4 July, according to Khan) | Rhee and Belot 1990, 8; Khan 2015 |
| 1978 | Reaz Garments ships 10,000 shirts to a buyer in France | Sadiqur Rahman 2021; Yunus and Yamagata 2012, 3–4 |
| 1 April to 30 November 1979 | About 130 Desh recruits, 14 of them women, train at Daewoo’s plant in Busan | Rhee and Belot 1990, 7 |
| April 1980 | Desh begins production at Kalurghat, Chittagong, with 450 machines and 500 workers | Rhee and Belot 1990, 8; Khan 2015 |
| 15 April 1981 | The Bangladesh Export Processing Zones Authority is set up; the Chittagong zone opens in 1983 | S. M. Mahfuzur Rahman 2023 |
| 30 June 1981 | Desh ends its agreement with Daewoo | Rhee and Belot 1990, 11–12 |
| 1983 | BGMEA, the garment exporters’ association, begins with 12 members | BGMEA n.d.-b |
| 1985 | The United States imposes quotas; about 500 of more than 700 factories close by the end of the year | Rhee and Belot 1990, 17 |
| FY1990-91 | Garments pass half of Bangladesh’s exports (50.47%) | BGMEA n.d.-d |
| 18 March 1993 | The Child Labor Deterrence Act (S. 613) is introduced in the US Senate | US Congress 1993 |
| 4 July 1995 | BGMEA, the ILO and UNICEF sign a memorandum on child labour | Yunus and Yamagata 2012, 23 |
| 1 January 2005 | The last quotas under the WTO Agreement on Textiles and Clothing end | Mlachila and Yang 2004, 6 |
| FY2005-06 | Garment exports grow 23.1% instead of falling | BGMEA n.d.-d |
| 2011 | The EU relaxes its rules of origin for garments from the least developed countries | Sytsma 2022 |
| 24 November 2012 | Fire at Tazreen Fashions, Ashulia: 112 workers dead or missing | IndustriALL 2016 |
| 24 April 2013 | Rana Plaza collapses at Savar; more than 1,100 people are killed | ILO 2023 |
| 2013 | The Accord on Fire and Building Safety in Bangladesh is signed, first by 40 brands and retailers | International Accord n.d. |
| 27 June 2013 | The United States announces the suspension of Bangladesh’s trade preferences under its GSP scheme | USTR 2013 |
| March 2020 | COVID-19: buyers cancel orders; 58% of surveyed suppliers shut most or all of their operations | Anner 2020a |
| June 2020 | The RMG Sustainability Council takes over the Accord’s work in Bangladesh | International Accord n.d. |
| FY2021-22 | Garment exports peak at US$42.61 billion on BGMEA’s figures, a year Sadiq Ahmed argues was also overstated | BGMEA n.d.-d; Ahmed 2024 |
| 1 December 2023 | A minimum wage of Tk 12,500 a month takes effect | TBS Report 2026 |
| July and August 2024 | Protests in which up to 1,400 people may have been killed end in a change of government | UN News 2025; Mirdha 2024 |
| 10 April 2026 | Labour (Amendment) Act No. 43 of 2026 sets union thresholds by factory size | Bangladesh 2026 |
| 29 October 2026 | The UN General Assembly moves graduation from the least developed country category to 24 November 2029 | Financial Express 2026b; Shah 2026 |
| 1 November 2026 | A new minimum wage board for garment workers is formed | Al Jazeera Staff and Reuters 2026 |
| 31 December 2026 | The Bangladesh Safety Agreement under the International Accord is due to expire | International Accord 2023 |
Before 1978: jute, not clothing
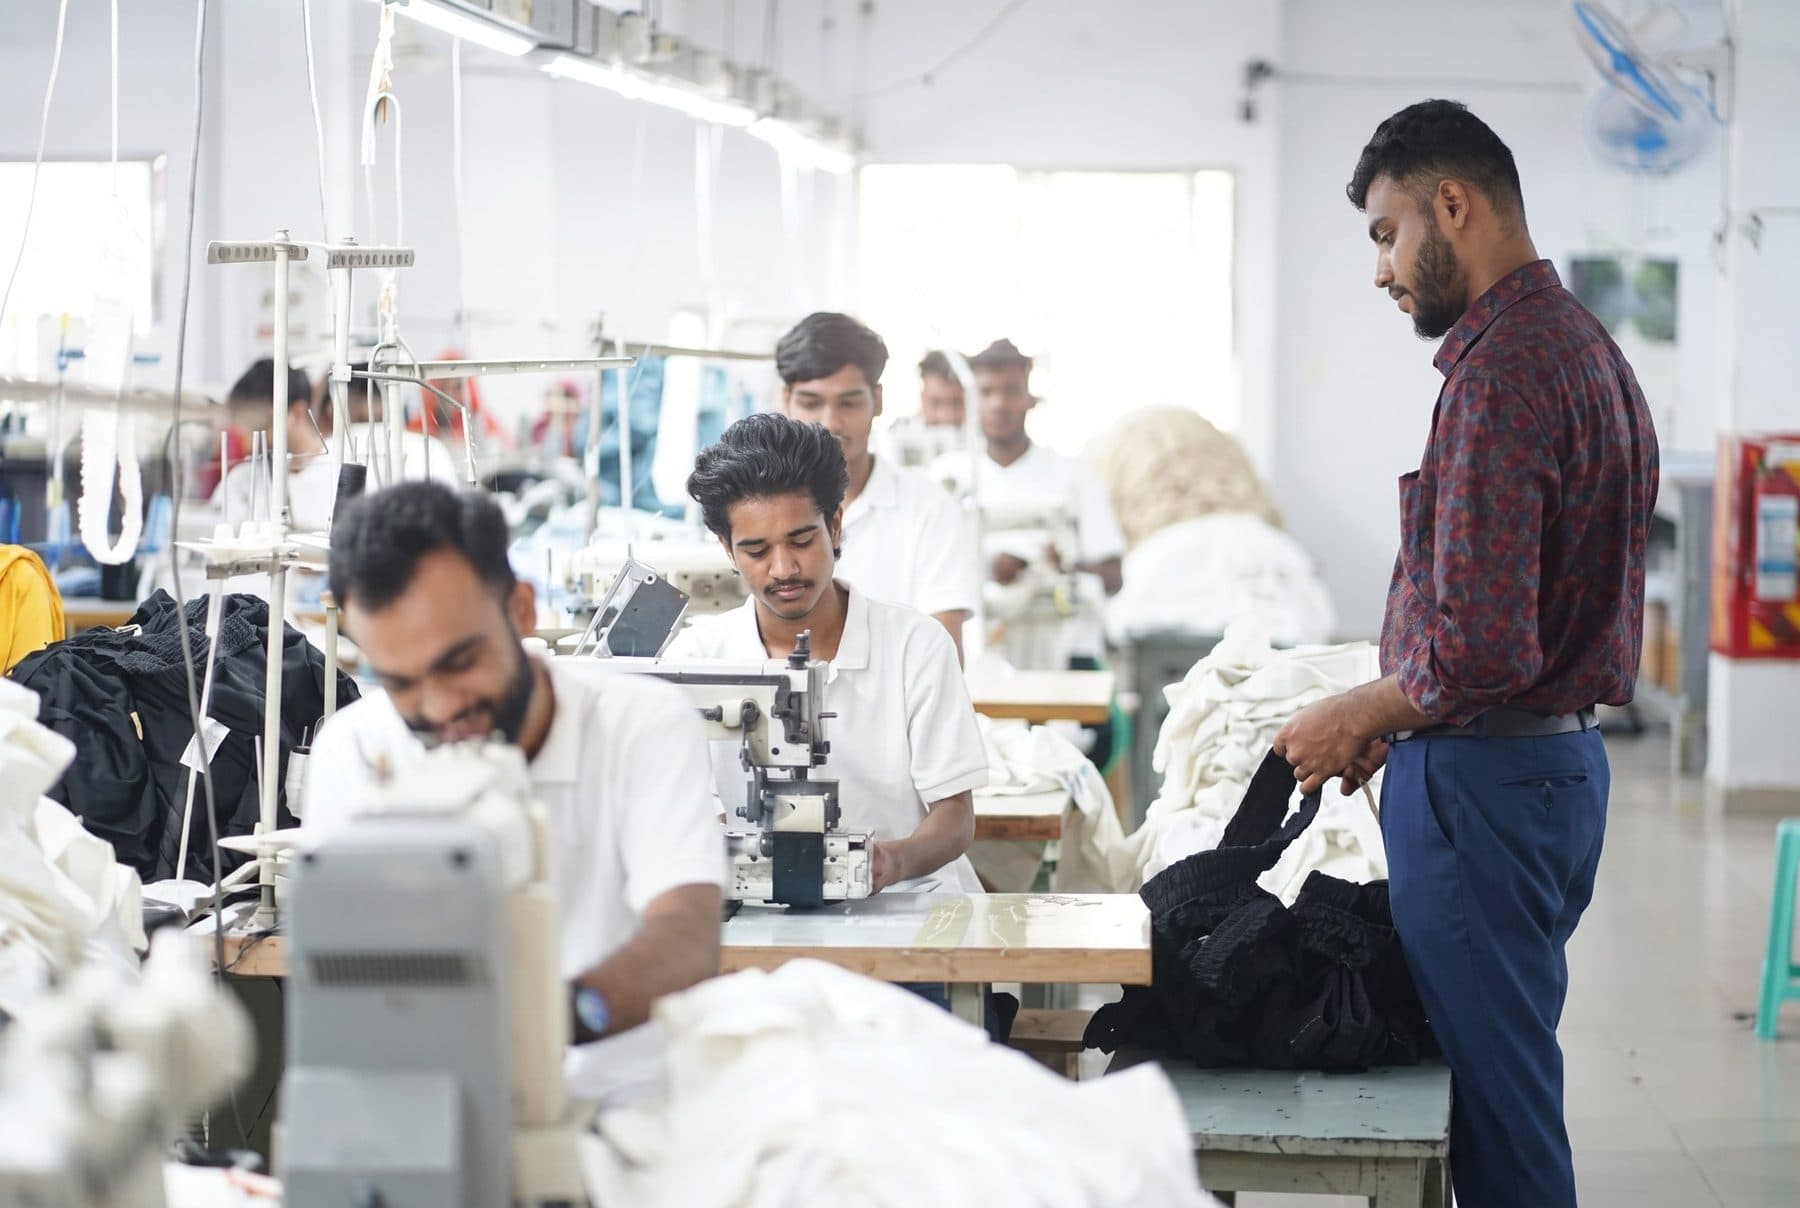
Before independence, industry in East Pakistan meant jute. By 1969/70 there were 77 jute mills employing about 170,000 people, and jute goods earned 46% of Pakistan’s foreign exchange (Islam 2021). Even in the late 1970s, Kabeer and Mahmud write, clothing for the home market came from tailoring shops and “a small ready-made garment industry catering primarily to urban markets” (Kabeer and Mahmud 2004b, 136). No source we consulted records garment exports from East Pakistan. We did not search Pakistan-era trade statistics, so this absence is unproven rather than established.
After independence in 1971, President’s Order No. 27 of 1972 nationalised large industrial enterprises (Bangladesh 1972). In the words of Yunus and Yamagata, the government “started to nationalize all large-scale industries, in particular, jute and cotton textiles, sugar, and most banks” (Yunus and Yamagata 2012, 4). In our reading, there were no large garment firms to nationalise, which helps explain why the export garment industry grew up in private hands. The ceiling on private investment was raised in stages and “finally withdrawn in September 1978” (Yunus and Yamagata 2012, 5).
“First garment export” needs care. The state’s Trading Corporation of Bangladesh shipped shirts to Eastern Europe under counter-trade in the mid-1970s, according to Yunus and Yamagata, who give no year or quantity (Yunus and Yamagata 2012, 4). The 1978 shipment by Reaz Garments described below is therefore best called the first export by a private Bangladeshi garment firm to a Western buyer.
Reaz, Desh and Daewoo, 1978 to 1985
Reaz Garments and the first shipment to France
BGMEA’s own history of the industry names, among its pioneers, “the late Akhter Mohammad Musa of Bond Garments, the late Mohammad Reazuddin of Reaz Garments” (BGMEA n.d.-a). Reaz’s founder was therefore Reazuddin, not Musa, as some accounts say. Reazuddin opened Reaz Store in Chawkbazar, Dhaka, around 1960; the shop and its workshop were burned during the war of 1971; the firm was renamed Reaz Garments Ltd in 1973; and on 28 July 1978 it shipped 10,000 shirts to a buyer in France (Sadiqur Rahman 2021). The exact date and the buyer’s name come from one newspaper feature based on an interview with Reazuddin’s son. Two other accounts give the founding, the renaming and the 1978 shipment in nearly identical words, so they are one tradition rather than two independent confirmations (Yunus and Yamagata 2012, 3–4; Khan 2015).
The shipment is often said to have been worth 13 million French francs (Yunus and Yamagata 2012, 4; Khan 2015). The Business Standard gives the same figure and calls it “equivalent to Tk427,000” (Sadiqur Rahman 2021). The two cannot both be right. By our approximate conversion at the exchange rates of 1978, Tk 427,000 was about 130,000 francs, or about 13 francs (roughly US$3) a shirt, far closer to the US$1.29 a shirt that Desh earned in 1979/80 (Rhee and Belot 1990, 12) than the 1,300 francs a shirt that 13 million would imply. We could not confirm either figure from a document of 1978.
Desh and Daewoo: a collaboration, not a joint venture
M. Noorul Quader, a former civil servant who left government service in 1975 (BGMEA 2025), founded Desh Garments and signed a five-year collaboration with Daewoo, the Korean group founded in 1967 as a garment maker and exporter (Rhee and Belot 1990, 5, 8). Under the agreement Daewoo trained Desh’s staff, sold it machinery and marketed its output, in return for a royalty of 3% of Desh’s sales (based on ex-factory costs) and a 5% sales commission. Daewoo took no shares and made no loan beyond short-term credit for fabric (Rhee and Belot 1990, 6). It was a collaboration agreement, not the joint venture it is sometimes called.
Rhee and Belot, who wrote the most detailed account from field interviews in 1987 and 1988 and Daewoo’s training plan, date the agreement to 1978 (Rhee and Belot 1990, 8). Quader’s daughter gives 4 July 1978 (Khan 2015), while BGMEA dates it to 1977 (BGMEA 2025) and Banglapedia dates Desh’s founding to 1979 (H. Siddiqi 2025). A plausible reading is that 1977 marks the first contacts, July 1978 the agreement and 1979 the start of the operating company.
Daewoo’s motive was quotas. It still drew about half of its exports from textiles and garments in 1978, and the United States and other rich countries were limiting imports of Korean clothing. Bangladesh, “not subject to garment quotas at that time”, offered Daewoo a way to keep selling Korean fabric and machinery (Rhee and Belot 1990, 5–6, 8–9). Kabeer and Mahmud call it meeting the “quota hopping” requirement of a product that was not a fully Korean operation (Kabeer and Mahmud 2004b, 136).
Desh advertised for trainees on 2 October 1978 (Khan 2015). Rhee and Belot, reproducing Daewoo’s training plan for 1 April to 30 November 1979 at its plant in Busan (then written Pusan), record 130 recruits, 14 of them women, who would later fill 4 management, 97 supervisory and 29 production posts (Rhee and Belot 1990, 7). That record contradicts BGMEA’s statement that the trainees went to Korea in 1978 (BGMEA n.d.-a). Mostafa and Klepper, who interviewed 88 of the trainees in 2006 and 2007, count 126 (Mostafa and Klepper 2009, 2, 4, 5, 16), and Khan counts 18 women (Khan 2015).
The trainees came home in December 1979, and production began in April 1980 with 450 machines and 500 workers (Rhee and Belot 1990, 8), at Kalurghat, Chittagong (Khan 2015). Desh’s first exports, in FY1979/80, were 43,000 shirts worth about US$56,000 (Rhee and Belot 1990, 8). Desh ended the agreement with Daewoo on 30 June 1981 (Rhee and Belot 1990, 11–12; Khan 2015).
What happened next is the centre of the story. Rhee and Belot record that 115 of the workers trained in Korea left Desh at different times after the agreement ended, to set up garment export firms of their own, often in competition with Desh (Rhee and Belot 1990, 12). Mostafa and Klepper date the movement: by 1984, when the industry had 294 firms, about three-quarters of the 126 trainees had left, and by 1988, 59 new firms had hired former Desh workers (Mostafa and Klepper 2009, 5–6). Their published article concludes that this “industry knowledge seeding was essential for the initial establishment and subsequent expansion” of the industry (Mostafa and Klepper 2018). Foreign partners came in other forms too: Youngones of Korea and Trexim formed the first equity joint venture in 1980, 51% Bangladeshi-owned, and shipped jackets to Sweden in December 1980 (Yunus and Yamagata 2012, 4).
Two tools that let firms start with little capital
Two arrangements let a new firm export without the money to buy its fabric. The special bonded warehouse allowed fabric to be imported free of duty, with customs checking it through passbooks and fixed ratios of fabric to garments. The back-to-back letter of credit let a local bank open an import letter of credit for the fabric against the buyer’s export letter of credit. Rhee and Belot describe both as working in Desh’s early years (Rhee and Belot 1990, 10–11), which in our reading means the early 1980s. Rhee and Belot credit Daewoo’s knowledge of Korea’s bonded system and Desh’s advice to the government, but concede that “there is no documented evidence” (Rhee and Belot 1990, 10). Yunus and Yamagata date both to 1980 on one page and to “during 1980s” on another (Yunus and Yamagata 2012, 5, 17). We found no government circular or customs order that dates either, so we say “the early 1980s”.
Firmer dates exist for other policy steps: a 17% devaluation in FY1980; the declaration of garments in 1980 as a “free sector” that needed no investment licence (Rhee and Belot 1990, 11, 13); the New Industrial Policy of 1982 and the Revised Industrial Policy of 1986 (Yunus and Yamagata 2012, 2); and the Bangladesh Export Processing Zones Authority, set up on 15 April 1981, whose first zone opened in Chittagong in 1983 (S. M. Mahfuzur Rahman 2023). Mostafa and Klepper, from their fieldwork, play the state’s role down: apart from duty-free machinery, bonded warehouses and back-to-back credit, “the government of Bangladesh did not aid the industry in any significant way” (Mostafa and Klepper 2009, 6).
The first boom and the 1985 quotas
BGMEA says it started “its journey in 1983” with 12 members (BGMEA n.d.-b). Banglapedia gives 1977 (Molla 2023); we use BGMEA’s own date. The number of factories rose from 9 export units in 1978, earning about US$1 million (Yunus and Yamagata 2012, 3), to 47 at the end of 1982 (H. Siddiqi 2025) and 294 in 1984 (Mostafa and Klepper 2009, 5). Then it exploded: “more than 700” factories were operating in 1985, about 80% of them founded that year (Rhee and Belot 1990, 17). Counts for FY1984-85 differ, from 587 (H. Siddiqi 2025) to 632 (Yunus and Yamagata 2012), most likely because the sources count different things.
The boom brought the first quotas. About 80% of Bangladesh’s garment exports went to the United States, and exports to the United States rose from US$37 million in 1984 to US$115 million in 1985, with growth in eight US product categories ranging from 105% to 5,766% (Rhee and Belot 1990, 16–17). The United States imposed quotas in 1985, and about 500 of the more than 700 factories had closed by the end of the year. In 1986 the United States almost tripled the quota levels, and over 1986 and 1987 about 300 factories reopened (Rhee and Belot 1990, 17).
The quota years, 1985 to 2004
World trade in clothing was managed by quotas from the Multi-Fibre Arrangement of 1974 (Yunus and Yamagata 2012, 6) until the WTO Agreement on Textiles and Clothing, which phased them out between 1995 and 2004. That agreement required importing countries to integrate at least 16%, 17% and 18% of their 1990 import volumes into normal trade rules in 1995, 1998 and 2002, and the remainder, up to 49%, on 1 January 2005, an “effective backloading” that the IMF expected to cause “a major shock at the beginning of 2005” (Mlachila and Yang 2004, 4, 6).
For Bangladesh, quotas were both a cap and a shelter. In 2001–02 it faced US quotas in 30 product categories (China faced 90), which it filled on average to 83% (Mlachila and Yang 2004, 13). The United States raised Bangladesh’s quotas by 8.1% a year in 1995–97 and 10.2% in 1998–2001, and the 12.9% a year to which it was entitled by 2002 was “60 percent higher than the average for its main competitors” (Mlachila and Yang 2004, 12–16). In the European Union, the IMF noted in 2004, Bangladesh “does not face any quotas”; Canada gave it duty-free and quota-free access from January 2003, and Norway had removed its quotas and, in 2002, its tariffs on goods from the least developed countries (Mlachila and Yang 2004, 8, 10, 17). The dependence was extreme: in 2002 garments were more than 77% of merchandise exports, and about 94% of garment exports went to markets with quotas, “among the highest ratios in the world” (Mlachila and Yang 2004, 4).
Growth in numbers
BGMEA’s series rises from US$116.2 million in FY1984-85 to US$624 million in FY1989-90, US$2,228 million in FY1994-95, US$4,349 million in FY1999-2000 and US$6,418 million in FY2004-05; garments passed half of all exports in FY1990-91 (BGMEA n.d.-d). The IMF counts export value rising “more than sixfold” between 1990 and 2002, and a first fall “in more than 20 years” in FY2001-02 (Mlachila and Yang 2004, 8–9). The only consistent series of factories and workers for these years that we found is the IMF’s, drawn from Ahmed and Sattar (2003): 594 factories and 0.2 million workers in FY1985-86, 834 and 0.4 million in FY1990-91, 2,353 and 1.3 million in FY1995-96, and 3,618 and 1.8 million in FY2001-02 (Mlachila and Yang 2004, 7). Around 2004 the industry employed about 1.8 million people, 40% of manufacturing employment, “90 percent of whom are women” (a figure the IMF takes from the US International Trade Commission), in firms that were 95% locally owned and about 90% located in and around Dhaka and Chittagong (Mlachila and Yang 2004, 6–7).
Child labour and the 1995 memorandum
On 18 March 1993 Senator Tom Harkin introduced the Child Labor Deterrence Act (S. 613) in the US Senate, “to prohibit the importation of goods produced abroad with child labor” (US Congress 1993). The bill set off “abrupt dismissals of thousands of child workers” in Bangladesh from 1993, with “as many as 40,000 to 50,000 children” reportedly laid off, a figure we could not confirm independently (Yunus and Yamagata 2012, 22–23). On 4 July 1995 BGMEA, the ILO and UNICEF signed a memorandum of understanding: no new children were to be hired, dismissals were to wait until school places existed, and children leaving factories were offered non-formal schooling with a stipend (Yunus and Yamagata 2012, 23).
The ILO’s independent evaluation of April 2004 found that the share of BGMEA factories employing children had fallen to 0.96%. But of 27,951 children identified, only 30% had been enrolled in school, 7% had completed skills training and 1.6% of families had received credit, and the monitoring system was “not yet sustainable without ILO’s support” (Jeddere-Fisher and Khair 2004, 1–3).
Knitwear and the pull of local fabric
Knitwear grew from 14.2% of garment exports in FY1992-93 to 43.9% in FY2004-05, and first overtook woven garments in FY2007-08, at 51.7% (our calculation from BGMEA n.d.-d). The IMF explains why: knit fabric could be made in Bangladesh, giving domestic value added of “up to 80 percent” and making it easier to meet the EU’s rules of origin, which imposed “a considerable constraint” on woven garments made from imported cloth (Mlachila and Yang 2004, 8, 10). A cash payment to domestic suppliers of fabric to export garment makers, 10% of the value added of exported garments by 2004 after being cut from 25% in FY01, cost about Tk 6 billion a year in the early 2000s, and the IMF judged that its benefits were “captured by a few textile manufacturers” (Mlachila and Yang 2004, 25). Knitwear makers have their own association, BKMEA; our guide to BGMEA and BKMEA sets out how the two differ.
Export processing zones
Export processing zones supplied only “about 10–12 percent of total exports” in the early 2000s but drew most foreign direct investment (Mlachila and Yang 2004, 7). Their labour regime differed from the rest of the country: writing in 2012, Yunus and Yamagata describe garment workers in the zones as “barred by law from organizing trade unions of their own” (Yunus and Yamagata 2012, 15).
After the quotas, 2005 to 2012
The forecasts for the end of quotas were grim. The IMF’s central case had Bangladesh’s clothing exports falling 17.7%, clothing output 17.0% and total employment 4.5%, with scenarios for exports ranging from a fall of 6.2% to one of 38.1%; a simple extrapolation gave a loss of 25%, and an estimate by Cookson that the IMF reports put it at 35% (Mlachila and Yang 2004, 25–29).
Instead, garment exports grew 23.1% in FY2005-06, from US$6,418 million to US$7,901 million, and roughly tripled to US$19,090 million by FY2011-12 (BGMEA n.d.-d). Yunus and Yamagata, citing the Export Promotion Bureau’s slightly different figure of 23.5%, concluded that “Bangladesh comes as winner in the post-MFA world” (Yunus and Yamagata 2012, 8). Part of the reason is that the old system “partially survived up to 2008”: under an agreement of 10 June 2005 the EU limited the growth of its garment imports from China to about 10% a year, and a US–China agreement of November 2005 set quotas on nearly half of US garment imports from China until the end of 2008 (Yunus and Yamagata 2012, 6–7). No source we found separates the effect of these limits on China from Bangladesh’s own competitiveness.
In 2008, garment labour for the US market cost US$0.22 an hour in Bangladesh, against US$0.38 in Vietnam and US$0.55 to US$1.08 in China (Yunus and Yamagata 2012, Table 2).
Everything But Arms and the rules of origin
The EU’s Everything But Arms (EBA) scheme, duty-free access for the least developed countries, came into force in March 2001. Strict rules of origin, however, meant that “less than half of Bangladesh’s exports actually receives duty-free treatment” (Mlachila and Yang 2004, 10). In 2011 the EU let garment makers in the least developed countries use imported fabric. A firm-level study finds that the old rules “effectively cut the preferential margin by three-fourths” and that the change raised firms’ revenue, mainly through larger shipments and higher-quality products (Sytsma 2022). The 43.4% jump in garment exports in FY2010-11 (BGMEA n.d.-d) should not be credited to the rule change alone, in our reading, because it was also the year exports recovered from the global recession.
Fire, collapse and reform
Bangladesh’s factory disasters did not begin in 2012, but the earlier fires and collapses are recorded mainly in newspaper reports that we did not open for this page, so we do not list them here.
Tazreen, 2012
On 24 November 2012 fire swept through Tazreen Fashions in Ashulia, near Dhaka. The compensation scheme that followed paid US$2.17 million to the families of 112 dead and missing workers and to 174 injured workers, through a trust created by an agreement of November 2014 between the retailer C&A, the C&A Foundation, the global union IndustriALL and the Clean Clothes Campaign (IndustriALL 2016). Some reports give slightly higher death tolls; 112 is the number the scheme compensated.
Rana Plaza, 2013
On 24 April 2013 the Rana Plaza building at Savar, which housed five garment factories, collapsed, killing at least 1,132 people and injuring more than 2,500, according to the ILO (ILO 2024). Other counts differ: IndustriALL gives 1,134 (IndustriALL 2026) and the Clean Clothes Campaign 1,138 (Clean Clothes Campaign n.d.), while an ILO retrospective says “over 1,100” (ILO 2023). In our reading the differences reflect when each count was made, as injured people died and remains were identified after the search ended, and whether the missing were included; no source we found reconciles the counts name by name. We use the ILO’s “at least 1,132”.
Compensation came through voluntary funds rather than the law. The Rana Plaza Donors Trust Fund, set up in January 2014, estimated that “$30 million would be required”, reached that target in June 2015 and paid US$18,468,277.95. Primark separately paid US$12,491,009.73 to 1,154 people, and the Prime Minister’s fund paid US$3,050,074.29, for a total of “just over $34 million” (Rana Plaza Arrangement n.d.). Payments were complete by October 2015 (ILO 2023). The Tazreen scheme followed the Rana Plaza method, calculating loss of income on the basis of ILO Convention 121 (IndustriALL 2016).
Inspections, the Accord and the government
The Accord on Fire and Building Safety in Bangladesh, a five-year binding agreement between global unions and brands, began with 40 brands and retailers and had 220 brand signatories by July 2015 (International Accord n.d.); IndustriALL counts 43 first signatories (IndustriALL 2026). Together, the Accord, the Alliance for Bangladesh Worker Safety, a separate programme led by brands, and the government-led National Initiative assessed 3,780 actively exporting factories. Thirty-nine were closed at once as imminent dangers, and the number of labour inspectors rose from 92 to 393 and of fire inspectors from 55 to 365. Under the 2013 amendment to the Labour Act, about 6,000 safety committees were also formed in garment factories and other sectors (ILO 2023). The EU’s Sustainability Compact with Bangladesh and the ILO, launched in 2013, is credited by the EU with 235 new inspectors and “nearly 350 trade unions and 220 Workers’ Welfare Associations” (European Commission n.d.).
On 27 June 2013 the United States announced that it would suspend Bangladesh’s trade preferences under its Generalized System of Preferences; announcing the decision, the US Trade Representative cited worker rights and “recent tragedies that needlessly took the lives of over 1,200 Bangladeshi garment factory workers” (USTR 2013).
In June 2020 the Accord’s office in Bangladesh passed to the RMG Sustainability Council (RSC), a body of industry, brands and unions. The International Accord followed in 2021 (International Accord n.d.), taking effect on 1 September 2021 (Clean Clothes Campaign n.d.), and the Bangladesh arrangement was renewed from 1 November 2023 (International Accord n.d.). The current Bangladesh agreement describes the RSC as a tripartite body with “the ultimate goal of transitioning to a regulatory body”, and its clause 33 states: “This agreement shall expire on 31 December 2026” (International Accord 2023). The International Accord itself runs to the end of 2026 with an automatic renewal for three more years (IndustriALL 2026); it is the Bangladesh country agreement that expires. In an interview published on 9 October 2026, the Accord’s executive director said it was “renegotiating the Bangladesh Safety Agreement”, while a BGMEA director on the RSC board said: “We do not want the Accord as a gatekeeper” (Saini 2026). On 31 October 2026 the Accord covered 248 brands and 1,772 factories, with average remediation progress of 81% (International Accord 2026). We found no signed renewal of the Bangladesh agreement by 22 November 2026.
Union law
The July 2013 amendment to the Labour Act eased the registration of unions, and the ILO counted 96 garment unions registered in 2013 and 222 in total, after “only two” in the previous two years (ILO 2014). By 28 February 2023 there were “approximately 1,201” registered garment unions, “of which 97% were active” (ILO 2023). Earlier rules required a fixed share of a factory’s workforce to join before a union could register. Act No. 43 of 2026, dated 10 April 2026, replaced that with a scale by factory size: a union now needs at least 20 members in an establishment of 20 to 300 workers, 40 in one of 301 to 500, 100 in one of 501 to 1,500, 300 in one of 1,501 to 3,000 and 400 in one of more than 3,000. The same Act shortened the period for reviewing the minimum wage from five years to three, and it replaced Ordinance No. 65 of 2025 (Bangladesh 2026).
Wages: every minimum-wage round
The table gives the legal minimum wage for garment workers at the entry grade at each round, in taka a month.
| Round | Entry-grade minimum (Tk a month) | Notes | Source |
|---|---|---|---|
| 1984 | 627 | Gazetted on 27 December 1984; The Daily Star dates the first wage structure to 1986 | TBS Report 2026; Star Business Report 2026 |
| 1994 | 930 | Set in 1994 | TBS Report 2026 |
| 2006 | 1,662.50 | Set in 2006 | TBS Report 2026 |
| 2010 | 3,000 | A basic wage of Tk 2,000, house rent of Tk 800 and a medical allowance of Tk 200 | TBS Report 2026; Yunus and Yamagata 2012, 27 |
| 2013 | 5,300 | Cornell’s brief gives Tk 5,000; we follow the gazetted figure as reported by The Business Standard | TBS Report 2026; Cornell GLI 2024 |
| 2018 | 8,000 | Set in 2018 | TBS Report 2026 |
| 2023 | 12,500 | In effect from 1 December 2023; four workers were killed in the protests during the 2023 round | TBS Report 2026; Cornell GLI 2024 |
| 2024 | 9% a year | The yearly increment on the basic wage rose from 5% to 9% from 1 December 2024 | TBS 2025 |
| 2026 | Not yet set | Board formed on 1 November 2026; the workers’ side proposed Tk 32,000 on 9 November; the owners had not yet submitted a figure when the third meeting was moved to 23 November | Al Jazeera Staff and Reuters 2026; Daily Star 2026; Prothom Alo 2026 |
The entry wage rose about twentyfold in taka between 1984 and 2023. We did not collect a consumer price series, so we make no claim about the change in real terms. Several rounds were accompanied by protests, and some were violent: during the 2023 protests four workers were killed (Cornell GLI 2024).
The minimum is far below independent estimates of a living wage. The Global Living Wage Coalition’s 2025 estimate for Dhaka is Tk 30,459 a month for a family of four with 1.58 earners (Global Living Wage Coalition 2025), about 2.4 times the Tk 12,500 floor set in 2023, before the annual increments on basic pay. The board formed on 1 November 2026 (Al Jazeera Staff and Reuters 2026) received a proposal of Tk 32,000 for the entry grade from its workers’ side on 9 November (Daily Star 2026); the owners had not yet put forward a figure when its third meeting was moved to 23 November (Prothom Alo 2026). No new rate had been agreed by 22 November 2026. Our wages guide follows the board and sets out every grade.
2014 to 2026
Exports: a peak, a correction and a plateau
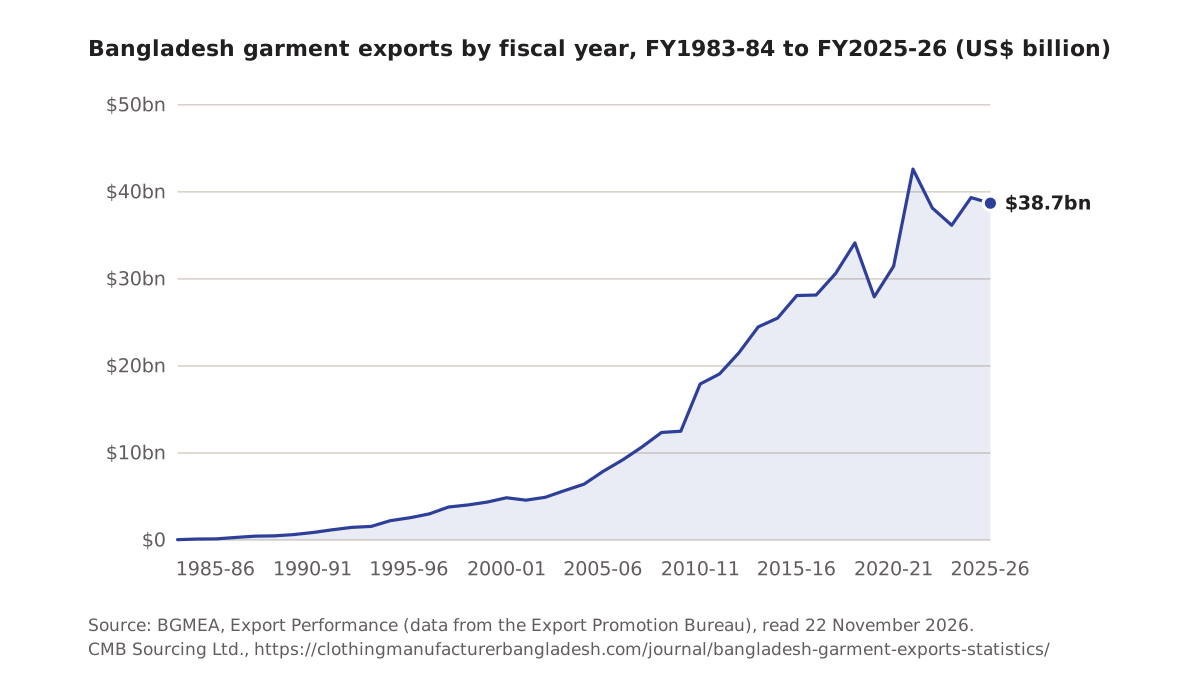
On BGMEA’s figures, garment exports rose from US$24.49 billion in FY2013-14 to US$34.13 billion in FY2018-19, fell 18.1% to US$27.95 billion in the COVID-19 year FY2019-20, and peaked at US$42.61 billion in FY2021-22 (BGMEA n.d.-d). BGMEA marks its figures for FY2022-23 and FY2023-24 with the sign ®, which we read as the revised figures (BGMEA n.d.-d). They follow the revision of July 2024, when Bangladesh Bank’s data showed that export earnings had been overstated; Sadiq Ahmed of the Policy Research Institute writes that actual earnings were significantly lower “since FY2022” and estimates the gap for FY2022 to FY2024 (Ahmed 2024). BGMEA revised only FY2022-23 and FY2023-24, so on his account the FY2021-22 peak of US$42.61 billion is probably overstated as well, and part of the fall after it is an accounting effect. Exports reached US$39.35 billion in FY2024-25 (BGMEA n.d.-d) and US$38.70 billion in FY2025-26, a fall of 1.64%, when the EU took 49.25%, the United States 20.01%, the United Kingdom 11.34%, Canada 3.47% and other markets 15.93% (Financial Express 2026c).
In WTO data for calendar years, Vietnam (US$29 billion) passed Bangladesh (US$28 billion) in 2020 (Daily Star 2021); in 2024 Bangladesh was again second after China, with about US$38.48 billion, 6.90% of world apparel exports, against China’s 29.64% (Prothom Alo 2025). In the US market alone, Bangladesh was third in 2025 with 10.53% of imports, behind Vietnam (21.50%) and China (13.66%) (Mirdha 2026). World rank and US-market rank measure different things and should not be mixed.
COVID-19: who carried the risk
A survey of 316 Bangladeshi suppliers in March 2020 by Penn State’s Center for Global Workers’ Rights and the Worker Rights Consortium found that, when orders were cancelled, 72.1% of buyers refused to pay for raw materials the supplier had already bought and 91.3% refused to pay the cost of cutting, making and trimming. Fifty-eight per cent of factories had shut most or all of their operations, more than a million workers had been fired or sent home, and 72.4% of those sent home went unpaid (Anner 2020a). Running totals of cancelled orders changed week by week in 2020, so any figure needs its date.
Green factories
BGMEA’s website gave 291 LEED-certified garment factories in Bangladesh, 125 of them at the top Platinum level, when we read it on 23 September 2026 (BGMEA n.d.-c). Press counts rose from 248 in June 2025 (UNB 2025) to 268 in October 2025, after a record 36 certifications in 2025 (Financial Express 2025), figures the Financial Express attributes to BGMEA, and 280 in March 2026, attributed to the BSS news agency and industry sources (Financial Express 2026a). We did not check the certifying body’s own directory.
The 2024 uprising
The UN human rights office’s fact-finding report estimates that as many as 1,400 people may have been killed in the protests of 1 July to 15 August 2024 (UN News 2025), in which the government fell (Mirdha 2024). On 12 September 2024, 219 garment factories shut in Ashulia; a month after the change of government the industrial police were not fully working, a government adviser said about 20% of orders had been cancelled, and a director of one large group said wages were not the issue (Mirdha 2024). Garment exports still grew 8.8% in FY2024-25 (BGMEA n.d.-d), so the damage fell on particular factories and months rather than on the year’s total.
US tariffs
On 2 April 2025 the United States announced a “reciprocal” tariff of 37% on goods from Bangladesh, and Executive Order 14326 of 31 July 2025 set the rate at 20% from 7 August 2025 (Ross et al. 2025; Executive Office of the President 2025). An Agreement on Reciprocal Trade announced in February 2026 provided that the United States “will maintain a 19 percent reciprocal tariff rate” and committed Bangladesh to a ban on imports made with forced labour, stronger union rights including in the export zones, and “a minimum wage review mechanism” (USTR 2026a). The 19% was never charged. On 20 February 2026 the US Supreme Court held that the emergency-powers law used for the reciprocal tariffs (IEEPA) does not authorise tariffs (Supreme Court of the United States 2026), and an executive order of the same day ended them (Executive Office of the President 2026a). A temporary 10% surcharge under Section 122 followed from 24 February to 23 July 2026 (Executive Office of the President 2026b), and from 24 July 2026 Section 301 tariffs placed Bangladesh in a 10% tier on top of normal duty (12.5% for China and Vietnam), with tariff-rate quotas for textiles linked to imports of US cotton and textile inputs to come when feasible (USTR 2026b; Smith and McGee 2026). Our guide to US tariffs, which found these rates unchanged when it last checked them on 14 November 2026, follows the changes.
Leaving the least developed country category
Bangladesh had been due to graduate from the UN’s least developed country category on 24 November 2026. The government elected in February 2026 asked for three more years, and on 29 October 2026 (New York time) the UN General Assembly, without objection, moved the date to 24 November 2029 (Shah 2026; Financial Express 2026b). Under the EU’s new GSP regulation, which applies from 1 January 2027, a graduating country keeps Everything But Arms for three years after graduation (European Commission 2026). Applied to the new date, that points to about November 2032, though we found no EU statement confirming it. Our guide to LDC graduation sets out what changes for each market.
How big the industry is now
Counts of factories and workers depend on who counts. Mapped in Bangladesh, a factory census run by BRAC University, counted 3,374 export-oriented factories in 2021, 672 of which belonged to neither BGMEA nor BKMEA; its authors started the census because, they wrote, there had been no actual count of firms or workers (Choudhury et al. 2021). Its 2025 booklet lists 3,315 export-oriented factories as of June 2025 (BRAC University CED 2025), and its impact report puts the workforce of the export-oriented industry at about 3 million (BRAC University CED 2024). The figure of “4 million workers” often quoted by the industry is not supported by the census, and adding the members of BGMEA and BKMEA together counts twice the factories that belong to both. Our statistics guide keeps the current figures.
Who works in the factories
The industry is known for employing women, but the share depends on what is counted, and the figures have fallen. A share of about 80% in 1980 is repeated widely; a 2023 study for the Ethical Trading Initiative attributes it to BGMEA in a chart, without a document or method (Ethical Trading Initiative 2023, 4), and we found no original measurement.
| Year | Women’s share | What is counted | Source |
|---|---|---|---|
| 1980 | About 80% | BGMEA, as charted in the ETI study; no method or original document found | Ethical Trading Initiative 2023, 4 |
| About 2004 | 90% | Employment in the industry, a figure the IMF takes from the US International Trade Commission | Mlachila and Yang 2004, 6–7 |
| 2015, 2018, 2021 | 54.22%, 53.89%, 53.65% | A BRAC University sample of export factories; in woven factories 60.64%, knit 51.84%, sweater 43.90% | Ethical Trading Initiative 2023 |
| December 2020 | 58.3% | A census of 3,223 export factories in four districts, as reported by The Daily Star | Mirdha 2020 |
| 2022 | 37.51% | All garment work in the national Labour Force Survey, as a minister told parliament, according to UNB | UNB 2024 |
The figures differ because they measure different populations. The household survey counts all garment work, which in our reading probably includes tailoring and work for the home market, where men are more common; and in the BRAC University sample, sweater and knit factories employ fewer women than woven ones (Ethical Trading Initiative 2023), while knitwear has grown fastest (BGMEA n.d.-d). The decline among exporters appears real, but for the high starting points of 80% and 90% we found no published method. For the trend, the BRAC University series is the most useful, because it uses one method across three years (Ethical Trading Initiative 2023). What the work has meant for the women who do it is one of the debates below.
What scholars disagree about
The facts above are broadly agreed. The causes and the consequences are not. Our summaries of the scholarly works rest on each work’s published abstract or registry record, except where we give a page number; three older articles (Rhee 1990, Kabeer 1991, and Ahmed, Greenleaf and Sacks 2014) have no abstract we could open and are summarised from their titles and how other scholars describe them. Read the works themselves before quoting them.
1. Why the industry succeeded
One group of scholars stresses a foreign catalyst. Rhee argues that Daewoo’s training and marketing seeded the industry (Rhee 1990), and Rhee and Belot generalise this into a “catalyst model” across eleven export successes (Rhee and Belot 1990). A second group locates the cause in people: Mostafa and Klepper show that workers who left Desh carried know-how to new firms (Mostafa and Klepper 2018), and Quddus and Rashid credit private entrepreneurs over state planning (Quddus and Rashid 2000). A third, political-economy view holds that export growth can happen even under weak governance: Ahmed, Greenleaf and Sacks call it a paradox of export growth in an area of weak governance (Ahmed, Greenleaf, and Sacks 2014). Yunus and Yamagata title their 2014 chapter “Bangladesh: Market Force Supersedes Control” (Yunus and Yamagata 2014). A fourth view, widely held, gives most weight to quotas and the foreign capital that came to Bangladesh to avoid them (Yunus and Yamagata 2012, 7). In our reading these accounts complement more than they compete: quotas explain why Daewoo came, the spread of knowledge explains how one firm became hundreds, and the bonded warehouse and back-to-back credit explain how firms with little capital could start. Researchers, Yunus and Yamagata note, have generally attributed the growth to the quota system and low wages (Yunus and Yamagata 2012, 7).
2. Women’s work: empowerment and exploitation
Naila Kabeer’s work refuses a simple verdict. She shows women in Dhaka weighing factory jobs against social norms and choosing them (Kabeer 1991; Kabeer 2000), warns that trade sanctions over labour standards could cost women jobs that improved their lives (Kabeer 2004), and compares women in export factories with those working for the home market (Kabeer and Mahmud 2004a). Dina Siddiqi questions the Western image of the “third world sweatshop worker” in need of rescue (D. Siddiqi 2009). Economists have added causal evidence. Heath and Mobarak find that girls exposed to garment jobs delayed marriage and childbirth and stayed in school longer (Heath and Mobarak 2015). In an experiment in large factories, Macchiavello and co-authors find that women promoted to supervisor performed worse during a trial period, which they link to bias against them, but that those kept on performed as well as men, and that factories went on to promote more women (Macchiavello et al. 2026). Payroll records show women’s wages about 20% lower than men’s; Menzel and Woodruff trace about half of the gap to men’s longer careers and the rest to differences in promotion within and between factories (Menzel and Woodruff 2021).
3. Wages and who carries the risk
Mark Anner argues that buyers’ purchasing practices, falling prices and shorter lead times, squeezed suppliers, and that suppliers passed the squeeze on to workers (Anner 2020b); his survey of March 2020 showed the same pattern when orders were cancelled during COVID-19 (Anner 2020a). Shahidur Rahman argues that integration into world markets created jobs but left workers, owners, unions and the state vulnerable (Shahidur Rahman 2013). The gap between the legal minimum and living-wage estimates, set out in the wages section above, is the number at the centre of this debate.
4. Safety: private rules or public regulation
Bair, Anner and Blasi find that the binding, union-signed Accord achieved substantially more on safety than the public Sustainability Compact, but that the state, opposed to pro-labour reform, undermined it (Bair, Anner, and Blasi 2020). Comparing the Accord with the brand-led Alliance, Donaghey and Reinecke argue that corporate social responsibility can fix problems quickly, but that only worker representation builds lasting capacity (Donaghey and Reinecke 2018). Kabeer, Huq and Sulaiman ask whether workers themselves saw a change (Kabeer, Huq, and Sulaiman 2020). Boudreau’s experiment shows that enforcing the legal requirement for safety committees raised compliance (Boudreau 2024). Ashraf and Prentice argue that the safety initiatives widened the gap between mainstream unions and workers’ militant protest, which was increasingly met with crackdowns, and could leave precarious workers more vulnerable (Ashraf and Prentice 2019). The question open in November 2026, who should govern the RMG Sustainability Council, how wide its mandate should be and what role the Accord keeps after its Bangladesh agreement expires on 31 December 2026 (Saini 2026), is this debate in institutional form.
5. How far the numbers can be trusted
The industry’s basic quantities are less certain than its history. Export figures for two recent years were revised in 2024, and Sadiq Ahmed argues that a third was overstated too (BGMEA n.d.-d; Ahmed 2024); the census team behind Mapped in Bangladesh began because no actual count of firms or workers existed, and its counts are themselves dated snapshots (Choudhury et al. 2021); women’s share runs from about 38% to about 60% depending on what is counted and when (UNB 2024; Mirdha 2020; Ethical Trading Initiative 2023, 4); and the founding years and factory counts of the 1980s differ between sources by up to about a hundred factories, as shown above. Naomi Hossain’s account of Bangladesh’s development as a whole, The Aid Lab, is a starting point for the wider question of why the country did better than its institutions predicted (Hossain 2017). We found no peer-reviewed work on upgrading and diversification (man-made fibres, design, higher-value products) that we could verify for this page, so that debate is not summarised here.
The numbers
The longest consistent series is BGMEA’s table of exports by fiscal year, compiled from Export Promotion Bureau data and including the 2024 revision (BGMEA n.d.-d). Garment exports were 3.89% of Bangladesh’s exports in FY1983-84, passed half in FY1990-91, and have been above 80% in every year since FY2013-14.
| Fiscal year | Woven | Knit | Garments, total | All exports | Garments’ share of exports (%) |
|---|---|---|---|---|---|
| 1983-84 | 31.57 | 811.00 | 3.89 | ||
| 1984-85 | 116.20 | 934.43 | 12.44 | ||
| 1985-86 | 131.48 | 819.21 | 16.05 | ||
| 1986-87 | 298.67 | 1,076.61 | 27.74 | ||
| 1987-88 | 433.92 | 1,231.20 | 35.24 | ||
| 1988-89 | 471.09 | 1,291.56 | 36.47 | ||
| 1989-90 | 624.16 | 1,923.70 | n/a (see note) | ||
| 1990-91 | 866.82 | 1,717.55 | 50.47 | ||
| 1991-92 | 1,182.57 | 1,993.90 | 59.31 | ||
| 1992-93 | 1,240.48 | 204.54 | 1,445.02 | 2,382.89 | 60.64 |
| 1993-94 | 1,291.65 | 264.14 | 1,555.79 | 2,533.90 | 61.40 |
| 1994-95 | 1,835.09 | 393.26 | 2,228.35 | 3,472.56 | 64.17 |
| 1995-96 | 1,948.81 | 598.32 | 2,547.13 | 3,882.42 | 65.61 |
| 1996-97 | 2,237.95 | 763.30 | 3,001.25 | 4,418.28 | 67.93 |
| 1997-98 | 2,844.43 | 937.51 | 3,781.94 | 5,161.20 | 73.28 |
| 1998-99 | 2,984.96 | 1,035.02 | 4,019.98 | 5,312.86 | 75.67 |
| 1999-00 | 3,081.19 | 1,268.22 | 4,349.41 | 5,752.20 | 75.61 |
| 2000-01 | 3,364.32 | 1,495.51 | 4,859.83 | 6,467.30 | 75.14 |
| 2001-02 | 3,124.82 | 1,458.93 | 4,583.75 | 5,986.09 | 76.57 |
| 2002-03 | 3,258.27 | 1,653.82 | 4,912.09 | 6,548.44 | 75.01 |
| 2003-04 | 3,538.07 | 2,148.02 | 5,686.09 | 7,602.99 | 74.79 |
| 2004-05 | 3,598.20 | 2,819.47 | 6,417.67 | 8,654.52 | 74.15 |
| 2005-06 | 4,083.82 | 3,816.98 | 7,900.80 | 10,526.16 | 75.06 |
| 2006-07 | 4,657.63 | 4,553.60 | 9,211.23 | 12,177.86 | 75.64 |
| 2007-08 | 5,167.28 | 5,532.52 | 10,699.80 | 14,110.80 | 75.83 |
| 2008-09 | 5,918.51 | 6,429.26 | 12,347.77 | 15,565.19 | 79.33 |
| 2009-10 | 6,013.43 | 6,483.29 | 12,496.72 | 16,204.65 | 77.12 |
| 2010-11 | 8,432.40 | 9,482.06 | 17,914.46 | 22,924.38 | 78.15 |
| 2011-12 | 9,603.34 | 9,486.39 | 19,089.73 | 24,301.90 | 78.55 |
| 2012-13 | 11,039.85 | 10,475.88 | 21,515.73 | 27,027.36 | 79.61 |
| 2013-14 | 12,442.07 | 12,049.81 | 24,491.88 | 30,186.62 | 81.13 |
| 2014-15 | 13,064.61 | 12,426.79 | 25,491.40 | 31,208.94 | 81.68 |
| 2015-16 | 14,738.74 | 13,355.42 | 28,094.16 | 34,257.18 | 82.01 |
| 2016-17 | 14,392.59 | 13,757.25 | 28,149.84 | 34,655.90 | 81.23 |
| 2017-18 | 15,426.25 | 15,188.51 | 30,614.76 | 36,668.17 | 83.49 |
| 2018-19 | 17,244.73 | 16,888.54 | 34,133.27 | 40,535.04 | 84.21 |
| 2019-20 | 14,041.19 | 13,908.00 | 27,949.19 | 33,674.09 | 83.00 |
| 2020-21 | 14,496.70 | 16,960.03 | 31,456.73 | 38,758.31 | 81.16 |
| 2021-22 | 19,398.84 | 23,214.32 | 42,613.15 | 52,082.66 | 81.82 |
| 2022-23 (revised) | 17,817.93 | 20,324.16 | 38,142.10 | 46,430.71 | 82.15 |
| 2023-24 (revised) | 16,869.16 | 19,282.15 | 36,151.31 | 44,469.74 | 81.29 |
| 2024-25 | 18,187.89 | 21,159.08 | 39,346.97 | 48,283.93 | 81.49 |
| 2025-26 | 18,077.32 | 20,623.83 | 38,701.15 | 48,001.91 | 80.62 |
Notes: the woven and knit split starts in FY1992-93. FY2022-23 and FY2023-24 are marked ® on BGMEA’s page, which we read as the figures revised in 2024; FY2021-22 was not revised, although Sadiq Ahmed argues it was also overstated (Ahmed 2024). For FY1989-90 BGMEA gives total exports of 1,923.70, more than the following year’s 1,717.55, which may be a typing error, so we do not show that year’s share. In FY2021-22 and FY2022-23 woven plus knit differs from the total by US$0.01 million, BGMEA’s own rounding. BGMEA’s page names its data source as “Export Promotion Bureau, Compiled by BGMEA” but gives no update date. For the current year, our exports guide has the monthly figures.
Further reading
The works below are the ones a student is most likely to need, grouped by subject, with one line on each. Full details are in the references.
How the industry began
- Rhee, Yung Whee, and Therese Belot. 1990. Export Catalysts in Low-Income Countries: A Review of Eleven Success Stories. World Bank Discussion Papers 72. Washington, DC: World Bank. The most detailed account of Desh and Daewoo, written from field interviews in 1987 and 1988 and Daewoo’s training plan. documents1.worldbank.org/curated/en/474231468740371757/pdf/multi-page.pdf
- Rhee, Yung Whee. 1990. “The Catalyst Model of Development: Lessons from Bangladesh’s Success with Garment Exports.” World Development 18 (2): 333–46. The same story as a model of development through a foreign catalyst. doi.org/10.1016/0305-750X(90)90057-5
- Mostafa, Romel, and Steven Klepper. 2018. “Industrial Development through Tacit Knowledge Seeding: Evidence from the Bangladesh Garment Industry.” Management Science 64 (2): 613–32. Traces how the Desh trainees spread know-how across the industry. doi.org/10.1287/mnsc.2016.2619
- Quddus, Munir, and Salim Rashid. 2000. Entrepreneurs and Economic Development: The Remarkable Story of Garment Exports from Bangladesh. Dhaka: University Press Limited. The case for entrepreneurs, rather than the state, as the industry’s founders. (A published review: doi.org/10.1163/27715086-00201009.)
Trade policy and quotas
- Mlachila, Montfort, and Yongzheng Yang. 2004. “The End of Textiles Quotas: A Case Study of the Impact on Bangladesh.” IMF Working Paper WP/04/108. Washington, DC: International Monetary Fund. https://doi.org/10.5089/9781451853131.001. How quotas worked for Bangladesh and what was expected when they ended. www.imf.org/external/pubs/ft/wp/2004/wp04108.pdf
- Yunus, Mohammad, and Tatsufumi Yamagata. 2012. “The Garment Industry in Bangladesh.” Chapter 6 in Dynamics of the Garment Industry in Low-Income Countries: Experience of Asia and Africa (Interim Report), edited by Takahiro Fukunishi. Chiba: IDE-JETRO. A long overview of the industry to 2011, with wage and cost tables. www.ide.go.jp/library/Japanese/Publish/Reports/InterimReport/2011/pdf/410_ch6.pdf
- Sytsma, Tobias. 2022. “Improving Preferential Market Access through Rules of Origin: Firm-Level Evidence from Bangladesh.” American Economic Journal: Economic Policy 14 (1): 440–72. Firm-level evidence on the EU’s 2011 change to rules of origin. doi.org/10.1257/pol.20200257
- Ahmed, Faisal Z., Anne Greenleaf, and Audrey Sacks. 2014. “The Paradox of Export Growth in Areas of Weak Governance: The Case of the Ready Made Garment Sector in Bangladesh.” World Development 56: 258–71. Why exports grew despite weak governance. doi.org/10.1016/j.worlddev.2013.11.001
Women and work
- Kabeer, Naila. 2000. The Power to Choose: Bangladeshi Women and Labour Market Decisions in London and Dhaka. London: Verso. The classic study of why women in Dhaka chose factory work. (A published review: doi.org/10.7202/000153ar.)
- Heath, Rachel, and A. Mushfiq Mobarak. 2015. “Manufacturing Growth and the Lives of Bangladeshi Women.” Journal of Development Economics 115: 1–15. Causal evidence that garment jobs delayed marriage and kept girls in school. doi.org/10.1016/j.jdeveco.2015.01.006
- Macchiavello, Rocco, Andreas Menzel, Atonu Rabbani, and Christopher Woodruff. 2026. “Promoting Women to Managerial Roles in the Bangladeshi Garment Sector.” Econometrica 94 (5): 1685–1716. An experiment on promoting women to supervisor. doi.org/10.3982/ECTA18759
- Siddiqi, Dina M. 2009. “Do Bangladeshi Factory Workers Need Saving? Sisterhood in the Post-Sweatshop Era.” Feminist Review 91 (1): 154–74. A critique of the Western “sweatshop” framing. doi.org/10.1057/fr.2008.55
After Rana Plaza
- Bair, Jennifer, Mark Anner, and Jeremy Blasi. 2020. “The Political Economy of Private and Public Regulation in Post-Rana Plaza Bangladesh.” ILR Review 73 (4): 969–94. Private and public regulation compared. doi.org/10.1177/0019793920925424
- Donaghey, Jimmy, and Juliane Reinecke. 2018. “When Industrial Democracy Meets Corporate Social Responsibility: A Comparison of the Bangladesh Accord and Alliance as Responses to the Rana Plaza Disaster.” British Journal of Industrial Relations 56 (1): 14–42. The Accord and the Alliance compared. doi.org/10.1111/bjir.12242
- Boudreau, Laura. 2024. “Multinational Enforcement of Labor Law: Experimental Evidence on Strengthening Occupational Safety and Health Committees.” Econometrica 92 (4): 1269–1308. An experiment on factory safety committees. doi.org/10.3982/ECTA19408
- Anner, Mark. 2020b. “Squeezing Workers’ Rights in Global Supply Chains: Purchasing Practices in the Bangladesh Garment Export Sector in Comparative Perspective.” Review of International Political Economy 27 (2): 320–47. How buyers’ purchasing practices affect wages and rights. doi.org/10.1080/09692290.2019.1625426
How this page was researched
We researched this page on 22 November 2026 in five parts: the origins to 1985, the quota years, safety and labour, the years since 2014, and the scholarship and data. Two independent readers then checked every sentence against the sources cited, and we corrected what they found. Where we could, we opened the source that first measured or reported a fact; where we cite a newspaper’s report of someone else’s figure, the sentence says so. Facts we saw only in a search engine’s summary are left out or, in a few places, named with the publication that reports them. A few sources (the wage gazette and increment notice, the wage board’s November 2026 meetings, the living-wage benchmark and the Mapped in Bangladesh reports) were opened for our wages guide and our statistics guide in the weeks before and were not reopened on 22 November. A few more (the ILO’s 2024 statement on Rana Plaza, BGMEA’s environment page and the US federal notices on tariffs) were opened for our Rana Plaza, factories and US tariffs guides. For the scholarly works we read each publisher’s abstract, registry record or, for two books, a published review; three older articles have no abstract we could open. We read in full only the working-paper draft of Mostafa and Klepper, the World Bank, IMF and IDE-JETRO studies, the Penn State report and the four-page summary of the ILO’s 2004 evaluation, whose page numbers we give where they are printed. The text of the 1972 nationalisation order could not be reopened for the second check.
What we could not verify, and therefore do not state: garment exports from East Pakistan before 1971; the exact dates of the first bonded-warehouse and back-to-back credit rules; any document of 1978 for the Reaz shipment; the months and categories of the first US quotas in 1985 and an EU restriction reported for the same year; who was BGMEA’s first president; factory and worker counts for 2005 to 2012; the names and death tolls of the factory disasters before 2012; the gazette dates of the 1994, 2010, 2013 and 2018 wage rounds; a signed renewal of the Bangladesh Safety Agreement; and BGMEA’s total-exports figure for FY1989-90.
Where sources disagree we give the range and say whose figure is whose. If you find an error, write to the address in the “Cite this page” box at the end of this page and we will correct it and note the change. To cite this page, use the Chicago, APA or Harvard entry in that box; for a single figure, cite the original source given here as well.
References
Chicago author-date style. Web pages were read on 22 November 2026 unless the entry says otherwise.
- Ahmed, Faisal Z., Anne Greenleaf, and Audrey Sacks. 2014. “The Paradox of Export Growth in Areas of Weak Governance: The Case of the Ready Made Garment Sector in Bangladesh.” World Development 56: 258–71. doi.org/10.1016/j.worlddev.2013.11.001.
- Ahmed, Sadiq. 2024. “What Are the Implications of Revised Export Figures?” The Daily Star (Dhaka), July 24, 2024. www.thedailystar.net/opinion/views/news/what-are-the-implications-revised-export-figures-3660881.
- Al Jazeera Staff and Reuters. 2026. “Bangladesh Forms Wage Board as Garment Workers Protest.” Al Jazeera, November 1, 2026. aljazeera.com/news/2026/11/1/bangladesh-forms-wage-board-amid-garment-worker-protests.
- Anner, Mark. 2020a. Abandoned? The Impact of Covid-19 on Workers and Businesses at the Bottom of Global Garment Supply Chains. Research report, March 27, 2020, with addendum of April 1, 2020. University Park, PA: Penn State Center for Global Workers’ Rights and Worker Rights Consortium. ler.la.psu.edu/wp-content/uploads/sites/4/2023/11/Abandoned_CGWR-WRCApril12020-2.pdf.
- Anner, Mark. 2020b. “Squeezing Workers’ Rights in Global Supply Chains: Purchasing Practices in the Bangladesh Garment Export Sector in Comparative Perspective.” Review of International Political Economy 27 (2): 320–47. doi.org/10.1080/09692290.2019.1625426.
- Ashraf, Hasan, and Rebecca Prentice. 2019. “Beyond Factory Safety: Labor Unions, Militant Protest, and the Accelerated Ambitions of Bangladesh’s Export Garment Industry.” Dialectical Anthropology 43 (1): 93–107. doi.org/10.1007/s10624-018-9539-0.
- Bair, Jennifer, Mark Anner, and Jeremy Blasi. 2020. “The Political Economy of Private and Public Regulation in Post-Rana Plaza Bangladesh.” ILR Review 73 (4): 969–94. doi.org/10.1177/0019793920925424.
- Bangladesh. 1972. The Bangladesh Industrial Enterprises (Nationalisation) Order, 1972 (President’s Order No. 27 of 1972). Dhaka: Legislative and Parliamentary Affairs Division. bdlaws.minlaw.gov.bd/act-378.html.
- Bangladesh. 2026. Bangladesh Śram (Sanśodhan) Āin, 2026 [Bangladesh Labour (Amendment) Act, 2026]. Act No. 43 of 2026, April 10, 2026. Dhaka: Legislative and Parliamentary Affairs Division. In Bengali. bdlaws.minlaw.gov.bd/act-details-1672.html.
- BGMEA (Bangladesh Garment Manufacturers and Exporters Association). n.d.-a. “About Garment Industry of Bangladesh.” Dhaka: BGMEA. Accessed November 22, 2026. bgmea.com.bd/page/AboutGarmentsIndustry.
- BGMEA. 2025. “Remembering M. Noorul Quader: Pioneer of Bangladesh’s 100% Export-Oriented RMG Industry.” September 13, 2025. www.bgmea.com.bd/page/Remembering_M._Noorul_Quader:_Pioneer_of_Bangladesh%E2%80%99s_100%25_Export-Oriented_RMG_Industry.
- BGMEA. n.d.-b. “BGMEA at a Glance.” Dhaka: BGMEA. Accessed November 22, 2026. www.bgmea.com.bd/page/aboutus.
- BGMEA. n.d.-c. “Environment.” Dhaka: BGMEA. Read for this site on September 23, 2026. www.bgmea.com.bd/page/Sustainability_Environment.
- BGMEA. n.d.-d. “Export Performance: Comparative Statement on Export of RMG & Total Export of Bangladesh.” Dhaka: BGMEA. Accessed November 22, 2026. www.bgmea.com.bd/page/Export_Performance.
- Boudreau, Laura. 2024. “Multinational Enforcement of Labor Law: Experimental Evidence on Strengthening Occupational Safety and Health Committees.” Econometrica 92 (4): 1269–1308. doi.org/10.3982/ECTA19408.
- BRAC University CED (Centre for Entrepreneurship Development). 2024. Mapped in Bangladesh: Impact Report 2022–24. Dhaka: BRAC University. ced.bracu.ac.bd/wp-content/uploads/2024/11/MiB-Impact-Report-2022_24_Final.pdf.
- BRAC University CED. 2025. Mapped in Bangladesh: Booklet 2025. Dhaka: BRAC University. ced.bracu.ac.bd/wp-content/uploads/2025/07/MiB-Booklet_2025_V11.pdf.
- Choudhury, Afshana, Fahim S. Chowdhury, Sadril Shajahan, and Faria Ahmad. 2021. “Beyond Digital Mapping of RMG Sector.” The Financial Express (Dhaka), September 6, 2021, updated January 28, 2023. thefinancialexpress.com.bd/views/economic-trends-and-insights/beyond-digital-mapping-of-rmg-sector.
- Clean Clothes Campaign. n.d. “Deaths and Injuries in the Global Garment Industry.” Amsterdam: Clean Clothes Campaign. Accessed November 22, 2026. cleanclothes.org/campaigns/the-accord/deaths-and-injuries-in-the-global-garment-industry.
- Cornell GLI (Global Labor Institute, Cornell University ILR School). 2024. Minimum Wage-Setting in Bangladesh’s Apparel Industry. Policy brief, November 2024. Ithaca, NY: Cornell University. ilr.cornell.edu/sites/default/files-d8/2024-11/cornell-gli-brief-bangladesh-november-2024.pdf.
- Daily Star. 2021. “Apparel Trade: Vietnam Overtakes Bangladesh.” The Daily Star (Dhaka), July 31, 2021. www.thedailystar.net/news/bangladesh/news/apparel-trade-vietnam-overtakes-bangladesh-2142021.
- Daily Star. 2026. “Labour Representatives Propose Tk 32,000 Minimum Monthly Wage for Garment Workers.” The Daily Star (Dhaka), November 9, 2026. www.thedailystar.net/business/news/labour-representatives-propose-tk-32000-minimum-monthly-wage-garment-workers-4319096.
- Donaghey, Jimmy, and Juliane Reinecke. 2018. “When Industrial Democracy Meets Corporate Social Responsibility: A Comparison of the Bangladesh Accord and Alliance as Responses to the Rana Plaza Disaster.” British Journal of Industrial Relations 56 (1): 14–42. doi.org/10.1111/bjir.12242.
- Ethical Trading Initiative. 2023. Where Are the Women? A Study on the Declining Number of Female Workers in the Bangladesh RMG Industry. Summary Report. London: Ethical Trading Initiative, with BRAC University and GIZ. ethicaltrade.org/sites/default/files/shared_resources/ETI_GIZ%20Study%20on%20Women%20Workers.pdf.
- European Commission, Directorate-General for Trade. n.d. “Labour Rights.” Accessed November 22, 2026. policy.trade.ec.europa.eu/development-and-sustainability/sustainable-development/labour-rights_en.
- European Commission. 2026. “The EU’s Renewed GSP Scheme: Key Updates for 2027.” Access2Markets, August 11, 2026. trade.ec.europa.eu/access-to-markets/en/news/eus-renewed-gsp-scheme-key-updates-2027.
- Executive Office of the President. 2025. “Further Modifying the Reciprocal Tariff Rates.” Executive Order 14326 of July 31, 2025. Federal Register 90 (149), August 6, 2025, doc. 2025-15010. www.govinfo.gov/content/pkg/FR-2025-08-06/html/2025-15010.htm.
- Executive Office of the President. 2026a. “Ending Certain Tariff Actions.” Executive Order 14389. Federal Register, February 25, 2026, doc. 2026-03832. www.federalregister.gov/documents/2026/02/25/2026-03832/ending-certain-tariff-actions.
- Executive Office of the President. 2026b. “Imposing a Temporary Import Surcharge to Address Fundamental International Payments Problems.” Proclamation 11012. Federal Register, February 25, 2026, doc. 2026-03824. www.federalregister.gov/documents/2026/02/25/2026-03824/imposing-a-temporary-import-surcharge-to-address-fundamental-international-payments-problems.
- Financial Express. 2025. “Bangladesh Sets New Record with 36 Factories Earning LEED Certification in a Year.” The Financial Express (Dhaka), October 23, 2025. thefinancialexpress.com.bd/trade/bangladesh-sets-new-record-with-36-factories-earning-leed-certification-in-a-year.
- Financial Express. 2026a. “5 Factories Get LEED Certification.” The Financial Express (Dhaka), March 30, 2026. today.thefinancialexpress.com.bd/print/5-factories-get-leed-certification-1774802200.
- Financial Express. 2026b. “Bangladesh’s LDC Graduation Deferred by Three Years.” The Financial Express (Dhaka), October 30, 2026. thefinancialexpress.com.bd/economy/bangladeshs-ldc-graduation-deferred-by-three-years.
- Financial Express. 2026c. “EU Share Erodes as Bangladesh RMG Exports Slip 1.64pc to $38.70b in FY26.” The Financial Express (Dhaka), July 7, 2026. thefinancialexpress.com.bd/home/eu-share-erodes-as-bangladesh-rmg-exports-slip-164pc-to-3870b-in-fy26.
- Global Living Wage Coalition. 2025. “Living Wage for Dhaka City, Bangladesh.” Living wage benchmark, 2025 estimate. Accessed November 2026. www.globallivingwage.org/living-wage-benchmarks/urban-bangladesh/.
- Heath, Rachel, and A. Mushfiq Mobarak. 2015. “Manufacturing Growth and the Lives of Bangladeshi Women.” Journal of Development Economics 115: 1–15. doi.org/10.1016/j.jdeveco.2015.01.006.
- Hossain, Naomi. 2017. The Aid Lab: Understanding Bangladesh’s Unexpected Success. Oxford: Oxford University Press. doi.org/10.1093/acprof:oso/9780198785507.001.0001.
- ILO (International Labour Organization). 2014. “Union Registrations Rise Sharply in Bangladesh Garment Sector: New Labour Laws Pave Way to Improve Conditions, Workers’ Rights.” News release, February 20, 2014. www.ilo.org/resource/news/union-registrations-rise-sharply-bangladesh-garment-sector-new-labour-laws.
- ILO. 2023. “The Rana Plaza Disaster Ten Years On: What Has Changed?” ILO InfoStories, April 2023. webapps.ilo.org/infostories/en-GB/Stories/Country-Focus/rana-plaza.html.
- ILO. 2024. “Employment Injury Insurance in Bangladesh: Bridging Social Security Cases.” Statement, January 2024. www.ilo.org/resource/statement/employment-injury-insurance-bangladesh-bridging-social-security-cases.
- IndustriALL Global Union. 2016. “Justice at Last for Tazreen Fire Victims.” July 7, 2016. www.industriall-union.org/justice-at-last-for-tazreen-fire-victims.
- IndustriALL Global Union. 2026. “International Accord: Achievements and Challenges.” September 16, 2026. www.industriall-union.org/300-brands-commit-to-worker-safety-but-the-real-test-lies-ahead/.
- International Accord for Health and Safety in the Textile and Garment Industry. 2023. Bangladesh Agreement on Health and Safety in the Textile and Garment Industry: Addendum to the International Accord. November 1, 2023. internationalaccord.org/wp-content/uploads/2023/11/CSSP-Bangladesh-Agreement_public-version.pdf.
- International Accord. 2026. “Bangladesh.” Country page, data as of October 31, 2026. Accessed November 22, 2026. internationalaccord.org/countries/bangladesh/.
- International Accord. n.d. “Bangladesh Safety Agreement: Origins.” Accessed November 22, 2026. internationalaccord.org/bangladesh-safety-agreement-origins/.
- Islam, Mufakharul. 2021. “Jute Industry.” In Banglapedia: National Encyclopedia of Bangladesh, online ed. Dhaka: Asiatic Society of Bangladesh. Last edited June 18, 2021. en.banglapedia.org/index.php/Jute_Industry.
- Jeddere-Fisher, Keith, and Sumaiya Khair. 2004. “Combined Evaluation of ILO/IPEC Garment Sector Projects as Part of the ‘Memorandum of Understanding’ Framework with the Bangladesh Garment Manufacturers and Exporters Association.” Evaluation summary, April 2004. Geneva: International Labour Office, IPEC. webapps.ilo.org/ievaldiscovery/files/file/383080.
- Kabeer, Naila, and Simeen Mahmud. 2004a. “Globalization, Gender and Poverty: Bangladeshi Women Workers in Export and Local Markets.” Journal of International Development 16 (1): 93–109. doi.org/10.1002/jid.1065.
- Kabeer, Naila, and Simeen Mahmud. 2004b. “Rags, Riches and Women Workers: Export-Oriented Garment Manufacturing in Bangladesh.” In Chains of Fortune: Linking Women Producers and Workers with Global Markets, edited by Marilyn Carr, 133–62. London: Commonwealth Secretariat. www.wiego.org/wp-content/uploads/2019/09/Kabeer-Mahmud-Export-Oriented-Garment-Bangladesh.pdf.
- Kabeer, Naila, Lopita Huq, and Munshi Sulaiman. 2020. “Paradigm Shift or Business as Usual? Workers’ Views on Multi-stakeholder Initiatives in Bangladesh.” Development and Change 51 (5): 1360–98. doi.org/10.1111/dech.12574.
- Kabeer, Naila. 1991. “Cultural Dopes or Rational Fools? Women and Labour Supply in the Bangladesh Garment Industry.” European Journal of Development Research 3 (1): 133–60. doi.org/10.1080/09578819108426544.
- Kabeer, Naila. 2000. The Power to Choose: Bangladeshi Women and Labour Market Decisions in London and Dhaka. London: Verso. A published review: doi.org/10.7202/000153ar.
- Kabeer, Naila. 2004. “Globalization, Labor Standards, and Women’s Rights: Dilemmas of Collective (In)action in an Interdependent World.” Feminist Economics 10 (1): 3–35. doi.org/10.1080/1354570042000198227.
- Khan, Vidiya Amrit. 2015. “Desh Garments: A Pioneer’s Gift to His Country.” The Daily Star (Dhaka), March 11, 2015, 24th anniversary supplement, part 3. www.thedailystar.net/supplements/24th-anniversary-the-daily-star-part-3/desh-garments-%E2%80%93-pioneer%E2%80%99s-gift-his-country-71128.
- Macchiavello, Rocco, Andreas Menzel, Atonu Rabbani, and Christopher Woodruff. 2026. “Promoting Women to Managerial Roles in the Bangladeshi Garment Sector.” Econometrica 94 (5): 1685–1716. doi.org/10.3982/ECTA18759.
- Menzel, Andreas, and Christopher Woodruff. 2021. “Gender Wage Gaps and Worker Mobility: Evidence from the Garment Sector in Bangladesh.” Labour Economics 71: 102000. doi.org/10.1016/j.labeco.2021.102000.
- Mirdha, Refayet Ullah. 2020. “Women Garment Workers: The Decline.” The Daily Star (Dhaka), December 14, 2020. www.thedailystar.net/business/news/women-garment-workers-the-decline-2011601.
- Mirdha, Refayet Ullah. 2024. “Deeper Crisis Feared as 219 Garment Factories Shut in Bangladesh.” The Daily Star (Dhaka), September 13, 2024; republished by Asia News Network. asianews.network/deeper-crisis-feared-as-219-garment-factories-shut-in-bangladesh/.
- Mirdha, Refayet Ullah. 2026. “Bangladesh’s Share in US Apparel Market Rises to 10.53%.” The Daily Star (Dhaka), February 25, 2026. www.thedailystar.net/business/news/bangladeshs-share-us-apparel-market-rises-1053-4114836.
- Mlachila, Montfort, and Yongzheng Yang. 2004. “The End of Textiles Quotas: A Case Study of the Impact on Bangladesh.” IMF Working Paper WP/04/108. Washington, DC: International Monetary Fund. https://doi.org/10.5089/9781451853131.001. www.imf.org/external/pubs/ft/wp/2004/wp04108.pdf.
- Molla, Md Tuhin. 2023. “Bangladesh Garment Manufacturers and Exporters Association.” In Banglapedia, online ed. Last edited October 14, 2023. en.banglapedia.org/index.php/Bangladesh_Garment_Manufacturers_and_Exporters_Association.
- Mostafa, Romel, and Steven Klepper. 2009. “Industrial Development through Tacit Knowledge Seeding: Evidence from the Bangladesh Garment Industry.” Working paper draft, November 2009. www.columbia.edu/~ev2124/igc/spring_2010/papers/mostafa.pdf.
- Mostafa, Romel, and Steven Klepper. 2018. “Industrial Development through Tacit Knowledge Seeding: Evidence from the Bangladesh Garment Industry.” Management Science 64 (2): 613–32. doi.org/10.1287/mnsc.2016.2619.
- Prothom Alo. 2025. “Bangladesh Retains Second Spot in Global Apparel Exports.” Prothom Alo English, July 10, 2025. en.prothomalo.com/business/local/mo5r8r5piq.
- Prothom Alo. 2026. “Postponed 3rd Meeting of Minimum Wage Board Rescheduled for Monday.” Prothom Alo English, November 17, 2026. en.prothomalo.com/business/local/7or6n45dxf.
- Quddus, Munir, and Salim Rashid. 2000. Entrepreneurs and Economic Development: The Remarkable Story of Garment Exports from Bangladesh. Dhaka: University Press Limited. A published review: doi.org/10.1163/27715086-00201009.
- Rahman, S. M. Mahfuzur. 2023. “Export Processing Zone.” In Banglapedia, online ed. Last edited October 14, 2023. en.banglapedia.org/index.php/Export_Processing_Zone.
- Rahman, Sadiqur. 2021. “Reazuddin: The Tailor Who Became the First RMG Exporter from Bangladesh.” The Business Standard (Dhaka), February 3, 2021. tbsnews.net/feature/panorama/reazuddin-tailor-who-became-first-rmg-exporter-bangladesh-196057.
- Rahman, Shahidur. 2013. Broken Promises of Globalization: The Case of the Bangladesh Garment Industry. Lanham, MD: Lexington Books. doi.org/10.5771/9780739178355.
- Rana Plaza Arrangement. n.d. “The Rana Plaza Donors Trust Fund.” Accessed November 22, 2026. ranaplaza-arrangement.org/trustfund/.
- Rhee, Yung Whee, and Therese Belot. 1990. Export Catalysts in Low-Income Countries: A Review of Eleven Success Stories. World Bank Discussion Papers 72. Washington, DC: World Bank. documents1.worldbank.org/curated/en/474231468740371757/pdf/multi-page.pdf.
- Rhee, Yung Whee. 1990. “The Catalyst Model of Development: Lessons from Bangladesh’s Success with Garment Exports.” World Development 18 (2): 333–46. doi.org/10.1016/0305-750X(90)90057-5.
- Ross, David J., Rhonda K. Schmidtlein, Neena Shenai, Lauren Mandell, Elizabeth A. Argenti, and Heather E. Hedges. 2025. “President Trump Announces New Reciprocal Tariffs Set to Take Effect This Week.” WilmerHale client alert, August 4, 2025. www.wilmerhale.com/en/insights/client-alerts/20250804-president-trump-announces-new-reciprocal-tariffs--set-to-take-effect-this-week.
- Saini, Mayu. 2026. “300 Signatories Later, Is the International Accord Facing a Deepening Divide?” Sourcing Journal, October 9, 2026; syndicated by Yahoo News. www.yahoo.com/news/world/articles/300-signatories-later-international-accord-190000622.html.
- Shah, Jahangir. 2026. “Bangladesh’s LDC Graduation Postponed by 3 Years to November 2029.” Prothom Alo English, October 30, 2026. en.prothomalo.com/bangladesh/addcsizr3s.
- Siddiqi, Dina M. 2009. “Do Bangladeshi Factory Workers Need Saving? Sisterhood in the Post-Sweatshop Era.” Feminist Review 91 (1): 154–74. doi.org/10.1057/fr.2008.55.
- Siddiqi, Hafiz G. A. 2025. “Garment Industry.” In Banglapedia, online ed. Last edited February 19, 2025. en.banglapedia.org/index.php/Garment_Industry.
- Smith, P. Lee, and Matthew McGee. 2026. “Forced Labor Section 301 Tariffs Imposed to Replace Expiring Section 122 Tariffs: What Importers Need to Know.” Baker Donelson, July 24, 2026. www.bakerdonelson.com/forced-labor-section-301-tariffs-imposed-to-replace-expiring-section-122-tariffs-what-importers-need-to-know.
- Star Business Report. 2026. “From Tk 627 to Tk 12,500: How Garment Workers’ Minimum Wage Has Changed since 1986.” The Daily Star (Dhaka), November 2, 2026. www.thedailystar.net/business/news/tk-627-tk-12500-how-garment-workers-minimum-wage-has-changed-1986-4313556.
- Supreme Court of the United States. 2026. Learning Resources, Inc. v. Trump, No. 24-1287. Decided February 20, 2026. www.supremecourt.gov/opinions/25pdf/24-1287_4gcj.pdf.
- Sytsma, Tobias. 2022. “Improving Preferential Market Access through Rules of Origin: Firm-Level Evidence from Bangladesh.” American Economic Journal: Economic Policy 14 (1): 440–72. doi.org/10.1257/pol.20200257.
- TBS (The Business Standard). 2025. “Govt Issues Gazette on 9% Yearly Wage Increment Hike for RMG Workers.” The Business Standard (Dhaka), January 2025. www.tbsnews.net/economy/rmg/govt-issues-gazette-9-yearly-wage-increment-hike-rmg-workers-1037271.
- TBS Report. 2026. “From Tk627 to Tk12,500: How Garment Workers’ Minimum Wages Have Changed.” The Business Standard (Dhaka), November 1, 2026. www.tbsnews.net/bangladesh/tk627-tk12500-how-garment-workers-minimum-wages-have-changed-1589381.
- UN News. 2025. “Bangladesh Protests Probe Reveals Top Leaders Led Brutal Repression.” United Nations, February 12, 2025. news.un.org/feed/view/en/story/2025/02/1160046.
- UNB (United News of Bangladesh). 2024. “State Minister Informs Parliament of Number of Workers in RMG Sector.” June 23, 2024. unb.com.bd/category/bangladesh/state-minister-informs-parliament-of-number-of-workers-in-rmg-sector/137930.
- UNB. 2025. “Bangladesh Leads World in Green Garment Factories.” June 16, 2025. unb.com.bd/category/Business/bangladesh-leads-world-in-green-garment-factories/161989.
- US Congress. Senate. 1993. Child Labor Deterrence Act of 1993. S. 613, 103rd Cong., 1st sess. Introduced March 18, 1993. www.congress.gov/103/bills/s613/BILLS-103s613is.pdf.
- USTR (Office of the United States Trade Representative). 2013. “U.S. Trade Representative Michael Froman Comments on President’s Decision to Suspend GSP Benefits for Bangladesh.” Press release, June 27, 2013. ustr.gov/about-us/policy-offices/press-office/press-releases/2013/june/michael-froman-gsp-bangladesh.
- USTR. 2026a. “Fact Sheet: The United States and Bangladesh Reach an Agreement on Reciprocal Trade.” February 2026. ustr.gov/about/policy-offices/press-office/fact-sheets/2026/february/fact-sheet-united-states-and-bangladesh-reach-agreement-reciprocal-trade.
- USTR. 2026b. “Notice of Actions in Section 301 Investigations of Acts, Policies, and Practices of Various Economies.” Federal Register, July 28, 2026, doc. 2026-15181. www.federalregister.gov/documents/2026/07/28/2026-15181/notice-of-actions-in-section-301-investigations-of-acts-policies-and-practices-of-various-economies.
- Yunus, Mohammad, and Tatsufumi Yamagata. 2012. “The Garment Industry in Bangladesh.” Chapter 6 in Dynamics of the Garment Industry in Low-Income Countries: Experience of Asia and Africa (Interim Report), edited by Takahiro Fukunishi. Chiba: IDE-JETRO. www.ide.go.jp/library/Japanese/Publish/Reports/InterimReport/2011/pdf/410_ch6.pdf.
- Yunus, Mohammad, and Tatsufumi Yamagata. 2014. “Bangladesh: Market Force Supersedes Control.” In The Garment Industry in Low-Income Countries: An Entry Point of Industrialization, edited by Takahiro Fukunishi and Tatsufumi Yamagata, 77–104. Basingstoke: Palgrave Macmillan. doi.org/10.1057/9781137383181_3.
Sources
Checked . Rules and figures change, so confirm anything that affects your pricing.
Show all 14 sourcesHide the sources
- Rhee and Belot (1990), Export Catalysts in Low-Income Countries, World Bank Discussion Papers 72, chapter II on Bangladesh (opens in a new tab)
- Mlachila and Yang (2004), The End of Textiles Quotas: A Case Study of the Impact on Bangladesh, IMF Working Paper 04/108 (opens in a new tab)
- Yunus and Yamagata (2012), The Garment Industry in Bangladesh, IDE-JETRO interim report, chapter 6 (opens in a new tab)
- BGMEA, Export Performance: garment and total exports by fiscal year, FY1983-84 to FY2025-26 (opens in a new tab)
- ILO (2023), The Rana Plaza disaster ten years on: what has changed? (opens in a new tab)
- Rana Plaza Arrangement, the Rana Plaza Donors Trust Fund (opens in a new tab)
- IndustriALL (2016), Justice at last for Tazreen fire victims (opens in a new tab)
- International Accord (2023), Bangladesh Agreement on Health and Safety, clause 33 (expiry on 31 December 2026) (opens in a new tab)
- Bangladesh Labour (Amendment) Act 2026, Act No. 43 of 2026 (in Bengali) (opens in a new tab)
- Jeddere-Fisher and Khair (2004), ILO evaluation of the BGMEA child-labour memorandum (opens in a new tab)
- Anner (2020), Abandoned? The impact of Covid-19 on workers and businesses at the bottom of global garment supply chains (opens in a new tab)
- Ethical Trading Initiative (2023), Where are the women? Study on women workers in the Bangladesh RMG industry (opens in a new tab)
- The Business Standard (2026), From Tk627 to Tk12,500: how garment workers’ minimum wages have changed (opens in a new tab)
- Prothom Alo (2026), Bangladesh’s LDC graduation postponed by 3 years to November 2029 (opens in a new tab)