Bangladesh exported US$38.70 billion of ready-made garments in the fiscal year to June 2026 (FY2025-26), according to the Export Promotion Bureau (EPB). That was 1.64% less than the year before and 80.6% of everything the country exported. In world terms, the World Trade Organization (WTO) puts Bangladesh at 6.8% of global clothing exports in 2025, second only to China among single countries. Almost half of the garments go to the European Union, a fifth to the United States and just over a tenth to the United Kingdom. This page puts those figures in one place, with the year and source for each, and explains what they mean when you are choosing where to produce.
The headline numbers for FY2025-26
Bangladesh’s fiscal year runs from July to June, so “FY2025-26” means 1 July 2025 to 30 June 2026. The EPB publishes the official export figures, and the garment makers’ association BGMEA republishes the garment lines. For FY2025-26 the EPB summary sheet gives:
- Total garment (RMG) exports: US$38,701 million, down 1.64% from US$39,347 million in FY2024-25.
- Knitwear (HS chapter 61): US$20,624 million, down 2.53%.
- Woven garments (HS chapter 62): US$18,077 million, down 0.61%.
- All goods exports: US$48,002 million, down 0.58%, so garments were 80.6% of the total.
The year ended better than it ran. June 2026 garment exports were US$3,388 million, 21.5% above June 2025. The new fiscal year has started in the same direction: for July and August 2026 the EPB reports garment exports of US$7,496 million, 5.1% more than the same two months of 2025. Two months is too short to call a trend, but it is the latest official reading.
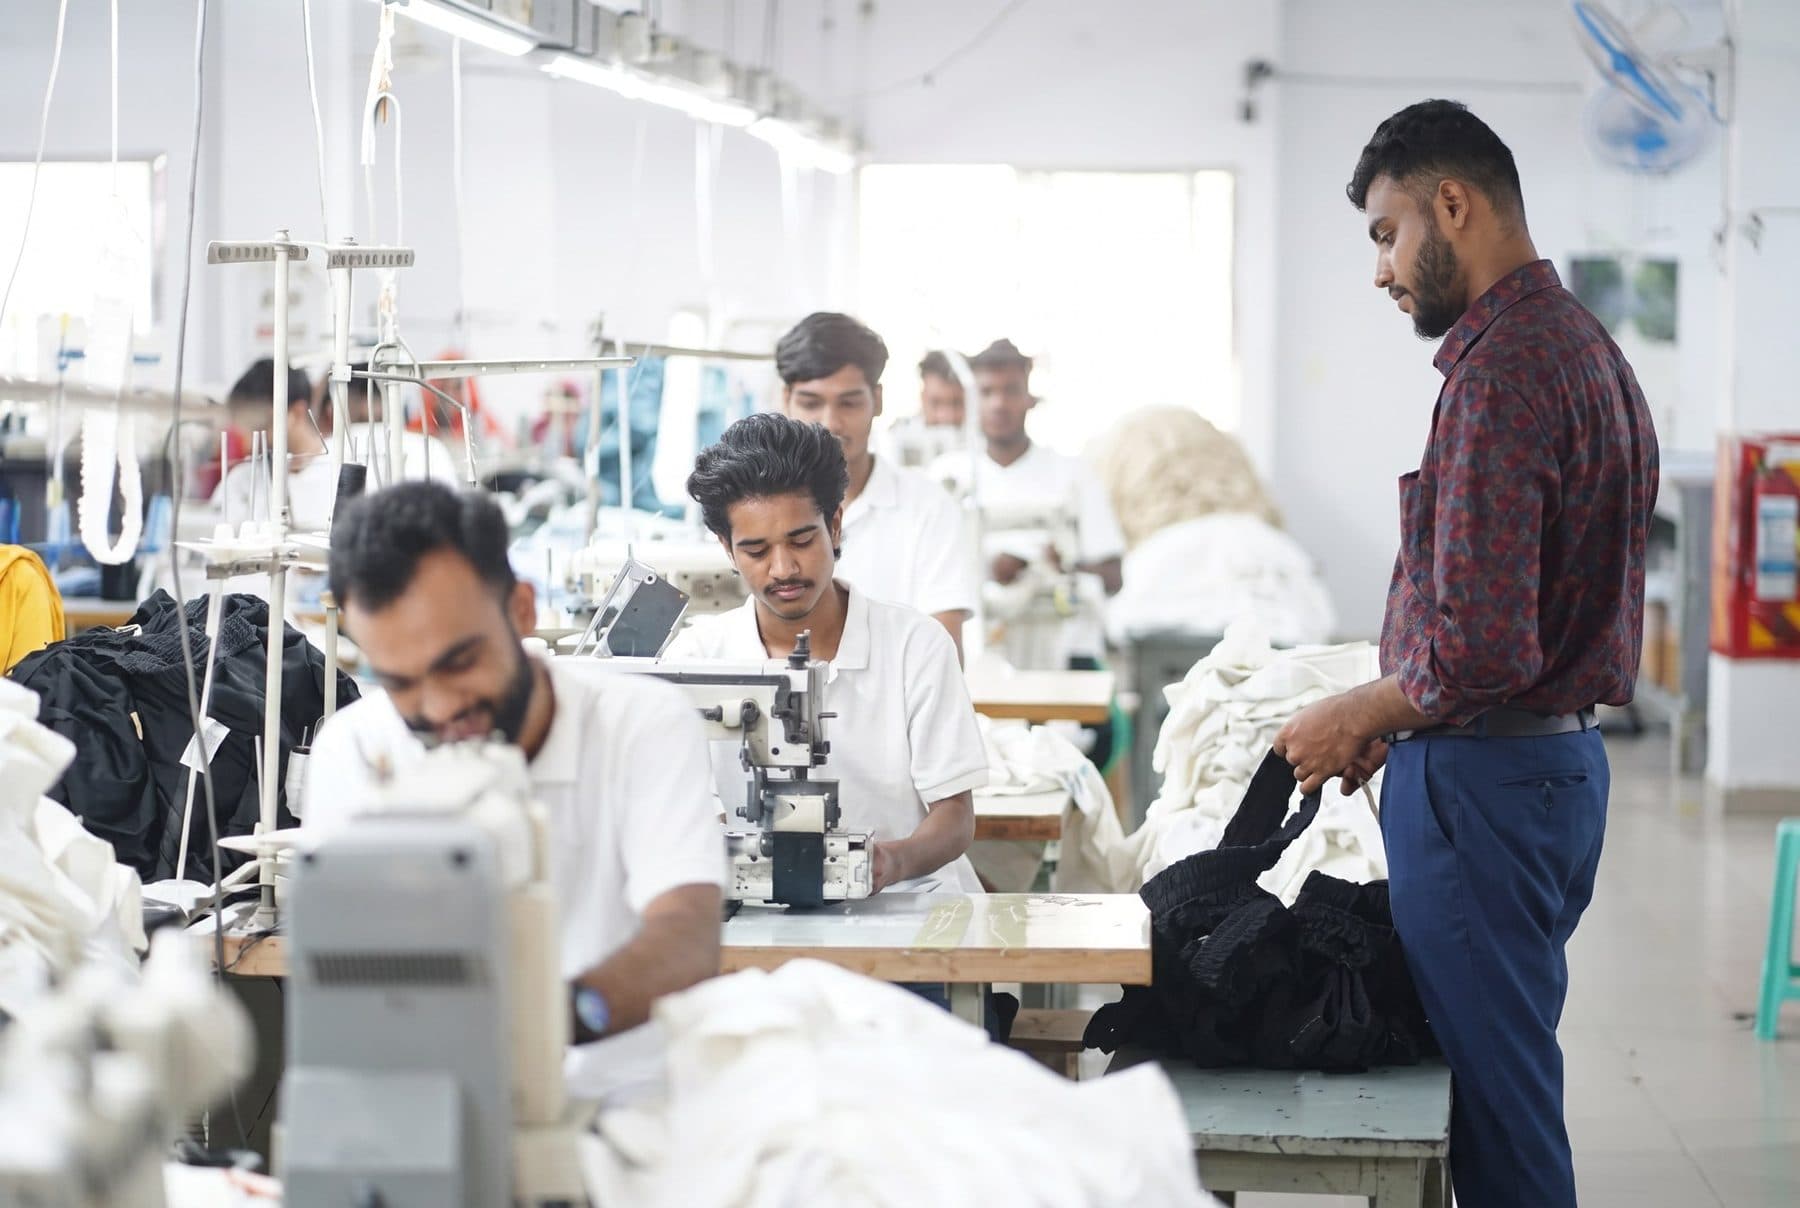
Knitwear and woven garments
Bangladesh’s export statistics split garments by customs chapter. Knitwear (chapter 61) is anything made from knitted fabric: t-shirts, polo shirts, sweatshirts, hoodies, sweaters, leggings, underwear and babywear. Woven garments (chapter 62) are made from woven fabric: shirts, trousers, jeans, jackets, coats and woven dresses. The chapter depends on how the fabric is made, not on what the garment looks like.
In FY2025-26 knitwear was 53.3% of garment exports and woven 46.7%. Knitwear has been the larger half in each of the last four fiscal years in BGMEA’s table. Woven exports held up better in FY2025-26, falling 0.61% against 2.53% for knitwear.
How the totals moved since FY2022-23
| Fiscal year | Knitwear | Woven | Total garments | Change on year | Share of all exports |
|---|---|---|---|---|---|
| FY2022-23 | 20.32 | 17.82 | 38.14 | n/a | 82.2% |
| FY2023-24 | 19.28 | 16.87 | 36.15 | -5.2% | 81.3% |
| FY2024-25 | 21.16 | 18.19 | 39.35 | +8.8% | 81.5% |
| FY2025-26 | 20.62 | 18.08 | 38.70 | -1.6% | 80.6% |
The table starts at FY2022-23 on purpose. In July 2024 Bangladesh Bank corrected its export figures after finding that multiple entries, equal to about 20% of the dataset, were problematic, and the gap between its figures and the EPB’s had passed US$12 billion in FY2022-23. Older headlines, including some that quote much higher garment totals, were published before that correction, so they are not comparable with the table above. When you see a Bangladesh export figure, check which year and which basis it uses.
The pattern over four years is flat, not falling: a dip in FY2023-24, a strong recovery in FY2024-25, and a small decline in FY2025-26 that was concentrated in the European Union.
Where the garments go: markets and shares
The EPB’s country-wise data for FY2025-26 shows how concentrated the customer base is. The shares below are calculated from the EPB’s knitwear and woven columns; the year-on-year changes are as reported from the same EPB data by The Business Standard.
| Destination | US$ billion | Share of garment exports | Change on FY2024-25 |
|---|---|---|---|
| European Union (27 countries) | 19.06 | 49.2% | -3.3% |
| United States | 7.74 | 20.0% | +2.6% |
| United Kingdom | 4.39 | 11.3% | +0.9% |
| Canada | 1.34 | 3.5% | +3.2% |
| All other markets | 6.16 | 15.9% | -4.3% |
Inside the EU, the largest buyers were Germany (US$4.38 billion), Spain (US$3.60 billion), the Netherlands (US$2.17 billion), France (US$1.97 billion), Poland (US$1.87 billion) and Italy (US$1.42 billion). Germany alone took almost exactly as much as the UK, but its purchases fell 11.5% on the year. Among the markets Bangladesh calls non-traditional, Japan took US$1.14 billion, Australia US$0.74 billion and India US$0.57 billion.
For brands in these markets, our pages for EU brands, US brands and UK brands cover the duty, labelling and shipping side.
What Bangladesh looks like from the importer’s side
Export figures tell you what Bangladesh shipped. Import figures tell you how much of your own market Bangladesh supplies. They use calendar years and local currencies, so they never match the EPB exactly.
- European Union. Eurostat’s trade database records EU imports of clothing (HS chapters 61 and 62) from outside the EU of €94.6 billion in 2025. Bangladesh supplied €19.47 billion of that, or 20.6%, second to China at €30.40 billion (32.1%) and well ahead of Türkiye at €8.36 billion (8.8%). Bangladesh’s share was 20.3% in both 2023 and 2024.
- United Kingdom. HMRC’s overseas trade statistics record £16.18 billion of clothing imports in 2025 under customs chapters 61 and 62, including imports from EU countries. China supplied £3.25 billion (20.1%) and Bangladesh £3.16 billion (19.5%), up from 17.2% in 2024 and 17.0% in 2023. The gap between the two has almost closed.
- United States. Sheng Lu of the University of Delaware, analysing data from the US Office of Textiles and Apparel (OTEXA), reports that US apparel imports fell 1.7% by value in 2025. Vietnam became the largest supplier with 21.5%, China fell to 13.7%, and the top three, China, Vietnam and Bangladesh, together held 45.7%. That leaves Bangladesh at roughly 10.5% of the US market for the year. In December 2025 alone its share was 10.0%, above China’s 9.6%.
So across the three big import markets, Bangladesh is the second-largest supplier to the EU, a close second in the UK, and third in the US.
Which products Bangladesh exports most
The EPB’s commodity-wise data breaks garment exports down by four-digit HS heading. Four headings make up 62.4% of the total.
| HS heading | What it covers | US$ billion | Share |
|---|---|---|---|
| 6109 | T-shirts, singlets and vests, knitted | 7.07 | 18.3% |
| 6203 | Men’s and boys’ suits, jackets, trousers and shorts, woven | 6.65 | 17.2% |
| 6204 | Women’s and girls’ suits, jackets, dresses, skirts and trousers, woven | 5.27 | 13.6% |
| 6110 | Jerseys, pullovers, cardigans and similar articles, knitted | 5.16 | 13.3% |
| 6104 | Women’s and girls’ suits, dresses, skirts and trousers, knitted | 2.08 | 5.4% |
| 6205 | Men’s and boys’ shirts, woven | 1.92 | 5.0% |
| 6108 | Women’s and girls’ underwear and nightwear, knitted | 1.37 | 3.5% |
| 6103 | Men’s and boys’ suits, jackets and trousers, knitted | 1.12 | 2.9% |
| 6105 | Men’s and boys’ shirts, knitted | 1.08 | 2.8% |
| 6111 | Babies’ garments, knitted | 0.94 | 2.4% |
T-shirts are the single largest line, at US$7.07 billion in FY2025-26. The two woven headings 6203 and 6204 are where trousers sit, alongside jackets, suits, skirts and dresses. Heading 6110 is the knitted pullover heading, which includes sweaters. Specialist lines are far smaller: knitted track-suits, ski-suits and swimwear (heading 6112) came to US$0.10 billion, against US$7.07 billion for t-shirts. Basics dominate, which is worth knowing before you assume every product has the same depth of supply. Our product pages set out what we make in each category.
Bangladesh’s share of world clothing exports
The WTO’s statistical tables for 2025 put world clothing exports at about US$574 billion (our calculation from Bangladesh’s value and share). The leading exporters were:
| Exporter | 2025 value | World share | Change in 2025 |
|---|---|---|---|
| China | 157.1 | 27.3% | -4.9% |
| Bangladesh | 38.8 | 6.8% | +0.9% |
| Vietnam | 37.5 | 6.5% | +10.5% |
| India | 17.3 | 3.0% | +5.5% |
| Türkiye | 16.8 | 2.9% | -6.1% |
| Cambodia | 11.6 | 2.0% | +16.9% |
| European Union, exports outside the EU | 44.2 | 7.7% | +2.2% |
One caveat changes the ranking. The WTO also lists the European Union as a single exporter at US$176.7 billion, or 30.8% of the world, but that figure includes trade between EU countries, such as Italy shipping to France. Counted that way the EU comes first. Counting single countries, Bangladesh is second. Counting only the EU’s exports to the rest of the world, the EU’s US$44.2 billion is slightly ahead of Bangladesh’s US$38.8 billion.
The longer run shows how Bangladesh got here. Its WTO share of world clothing exports was 2.6% in 2000, 2.5% in 2005 and 4.2% in 2010. The WTO’s 2023 review gave it 7.9% in 2022, the high point. By 2025 it was 6.8%, and Vietnam, growing more than ten times faster in 2025, was only US$1.3 billion behind. How Bangladesh, Vietnam, China and India compare for a buyer is covered in our guide to Bangladesh vs Vietnam vs China vs India.
How to read these numbers without being misled
- “What percentage of clothes are made in Bangladesh?” The honest answer is about 6.8% of the world’s clothing exports by value in 2025. That is not a share of all clothes made: garments made and sold inside China or India never enter trade statistics. It is also a share of value, not of pieces. No official source publishes a world share by piece count.
- Fiscal year or calendar year. The EPB’s US$38.70 billion is July 2025 to June 2026. The WTO’s US$38.8 billion is calendar 2025. They are different periods that happen to land close together.
- Export value or import value. Bangladesh records what leaves, in US dollars. The EU and UK record what arrives, in euros and pounds, at a different time. That is why the EPB shows exports to the EU down 3.3% in FY2025-26 while Eurostat shows EU imports from Bangladesh up in calendar 2025.
- Corrected and uncorrected data. Anything published before the July 2024 correction may overstate Bangladesh’s exports.
What the numbers mean for a buyer
A few practical conclusions follow from the data.
- Bangladesh is a volume specialist in a small number of products. T-shirts, knitted pullovers and sweaters, and the two woven headings that hold trousers and jackets made up 62.4% of garment export value in FY2025-26. If your range sits in those headings, you are buying what the country ships most of.
- Europe is the core customer. About 60% of garment exports went to the EU and UK combined in FY2025-26. Producing for European buyers is the main business of the industry, not a sideline, and Bangladesh supplies about a fifth of the clothing both markets import.
- The market is not growing fast. Garment exports have moved between US$36 billion and US$39 billion a year for four years, and Bangladesh’s world share has slipped from its 2022 peak. That is a reason to compare quotes and lead times carefully, not a reason to avoid the country.
- Trade rules are changing. Much of the EU trade runs duty free under Everything But Arms, the EU scheme for least developed countries. Bangladesh is scheduled to leave that UN category on 24 November 2026. In February 2026 it asked for a longer preparatory period, and in July 2026 the UN Economic and Social Council recommended that the General Assembly decide before that date. Our guide to LDC graduation and duty-free apparel explains what changes for buyers. Confirm the duty on your own product with your customs broker.
For how many factories produce these exports and where they are, see our guide to garment factories in Bangladesh. For the wider case, see why Bangladesh.
What to do next
If your products sit in the categories Bangladesh exports most, the next step is a real quote on your own specification. CMB Sourcing is a buying house in Narayanganj, Dhaka. We do not own sewing lines; we place orders with audited partner factories and name the factory in writing, with its address, certificates and audit reports, before production starts. Our full package production page explains how an order runs from fabric to shipment. Minimums start at 500 pieces per style and colour, and 1,000 for t-shirts. Send us your tech pack or product list and we will reply within one working day.
Questions buyers ask.
What percentage of the world’s clothes are made in Bangladesh?
The closest official measure is the share of world clothing exports, and the WTO’s statistical tables put Bangladesh at 6.8% in 2025, with exports of US$38.8 billion. That makes it the second-largest clothing exporter among single countries, after China at 27.3% and just ahead of Vietnam at 6.5%. Two limits apply. First, this is a share of exports, so clothing that China, India or other countries make and sell at home is not counted, so an export share is not the same thing as a share of all the clothing made in the world. Second, it is a share of value in US dollars, not of pieces, and no official source publishes a world share by number of garments. The trend is worth noting too: the WTO gave Bangladesh 7.9% in 2022, so its share has eased as Vietnam and Cambodia grew faster.
Which countries buy the most clothing from Bangladesh?
By country, the United States is the largest single buyer. EPB data for the fiscal year July 2025 to June 2026 shows US$7.74 billion of garments going there, 20.0% of the total. The United Kingdom and Germany come next with about US$4.39 billion and US$4.38 billion each, followed by Spain at US$3.60 billion, the Netherlands, France and Poland. Taken as a bloc, though, the European Union is far bigger than any single country: its 27 members took US$19.06 billion, or 49.2% of Bangladesh’s garment exports. Canada took US$1.34 billion and Japan US$1.14 billion. Everything outside the EU, US, UK and Canada, which Bangladesh calls non-traditional markets, came to US$6.16 billion, or 15.9%, and fell 4.3% on the year. From the import side, Bangladesh supplies about a fifth of the clothing the EU and the UK import.
Are Bangladesh’s garment exports growing or shrinking?
Roughly flat over four years, with swings. On EPB figures, garment exports were US$38.14 billion in FY2022-23, fell to US$36.15 billion in FY2023-24, recovered 8.8% to US$39.35 billion in FY2024-25, then eased 1.64% to US$38.70 billion in FY2025-26. The fall in the last year came mainly from the European Union, down 3.3%, and from smaller markets, while shipments to the United States, the United Kingdom and Canada rose slightly. The first two months of FY2026-27, July and August 2026, were 5.1% above the same months a year earlier. In world terms, WTO data shows Bangladesh’s clothing exports grew only 0.9% in calendar 2025, while Vietnam’s grew 10.5% and Cambodia’s 16.9%, so the gap to its nearest rival narrowed to about US$1.3 billion. Be careful with older headlines: figures published before the July 2024 data correction are not comparable with today’s.
Sources
Checked . Rules and figures change, so confirm anything that affects your pricing.
- Export Promotion Bureau, Bangladesh: export data July to June 2025-26 (summary sheet, country-wise and commodity-wise garment exports) (opens in a new tab)
- Export Promotion Bureau, Bangladesh: export data index, including July to August 2026-27 summary sheet (opens in a new tab)
- BGMEA: export performance, knit and woven garment exports by fiscal year and share of total exports (opens in a new tab)
- WTO: World Trade Statistics, statistical tables, Table 22 top 10 exporters and importers of clothing, 2025 (opens in a new tab)
- WTO: World Trade Statistical Review 2023, Table A23 top exporters of clothing, 2022 (Bangladesh 7.9%) (opens in a new tab)
- Eurostat: EU trade since 2002 by HS2-4-6 (DS-045409), extra-EU imports of HS 61 and 62 by partner, 2023 to 2025 (opens in a new tab)
- HMRC: UK overseas trade statistics (uktradeinfo), imports of HS 61 and 62 by country, 2023 to 2025 (opens in a new tab)
- Sheng Lu, University of Delaware, via ITC Global Textile Academy: US apparel import and sourcing patterns in 2025, from OTEXA data (opens in a new tab)
- The Business Standard: FY2025-26 garment exports by market, from EPB data (8 July 2026) (opens in a new tab)
- The Daily Star: export data gap and the July 2024 reset of Bangladesh’s export figures (opens in a new tab)
- European Commission, Access2Markets: Everything But Arms, duty-free access for least developed countries, Bangladesh a beneficiary (opens in a new tab)
- UN LDC Portal: Bangladesh graduation status (scheduled 24 November 2026; extension request and ECOSOC recommendation) (opens in a new tab)