In short
Yes, narrowly. US data for January to August 2026 ranks China second (US$5.63 billion) and Bangladesh third (US$5.39 billion), behind Vietnam. But Bangladesh’s sales fell 4.43% in a market down 7.42%, so its share rose, while China’s fell 29.39%. The gap is US$240 million.
Want a costing for your own style? Send us your enquiry
Yes, by a narrow margin. US government data for January to August 2026 puts China back in second place among apparel (clothing) suppliers to the United States, with Bangladesh third. The gap is US$240 million on sales of more than US$5 billion each. Bangladesh’s exports to the US fell 4.43% over those eight months, while China’s fell 29.39%.1
Did Bangladesh lose second place in US apparel imports?
The figures come from the Office of Textiles and Apparel (OTEXA), part of the US Department of Commerce, which publishes how much clothing the United States imports from each country. Bangladeshi newspapers reported the January to August numbers on 7 and 8 October 2026.
Bangladesh first became the second-largest supplier of ready-made garments (RMG) to the US in February 2026, when its running total for the year passed China’s.11 It was still second at the end of July, behind Vietnam and ahead of China. By the end of August, China had moved back into second place.2 Vietnam stayed first by a wide margin.
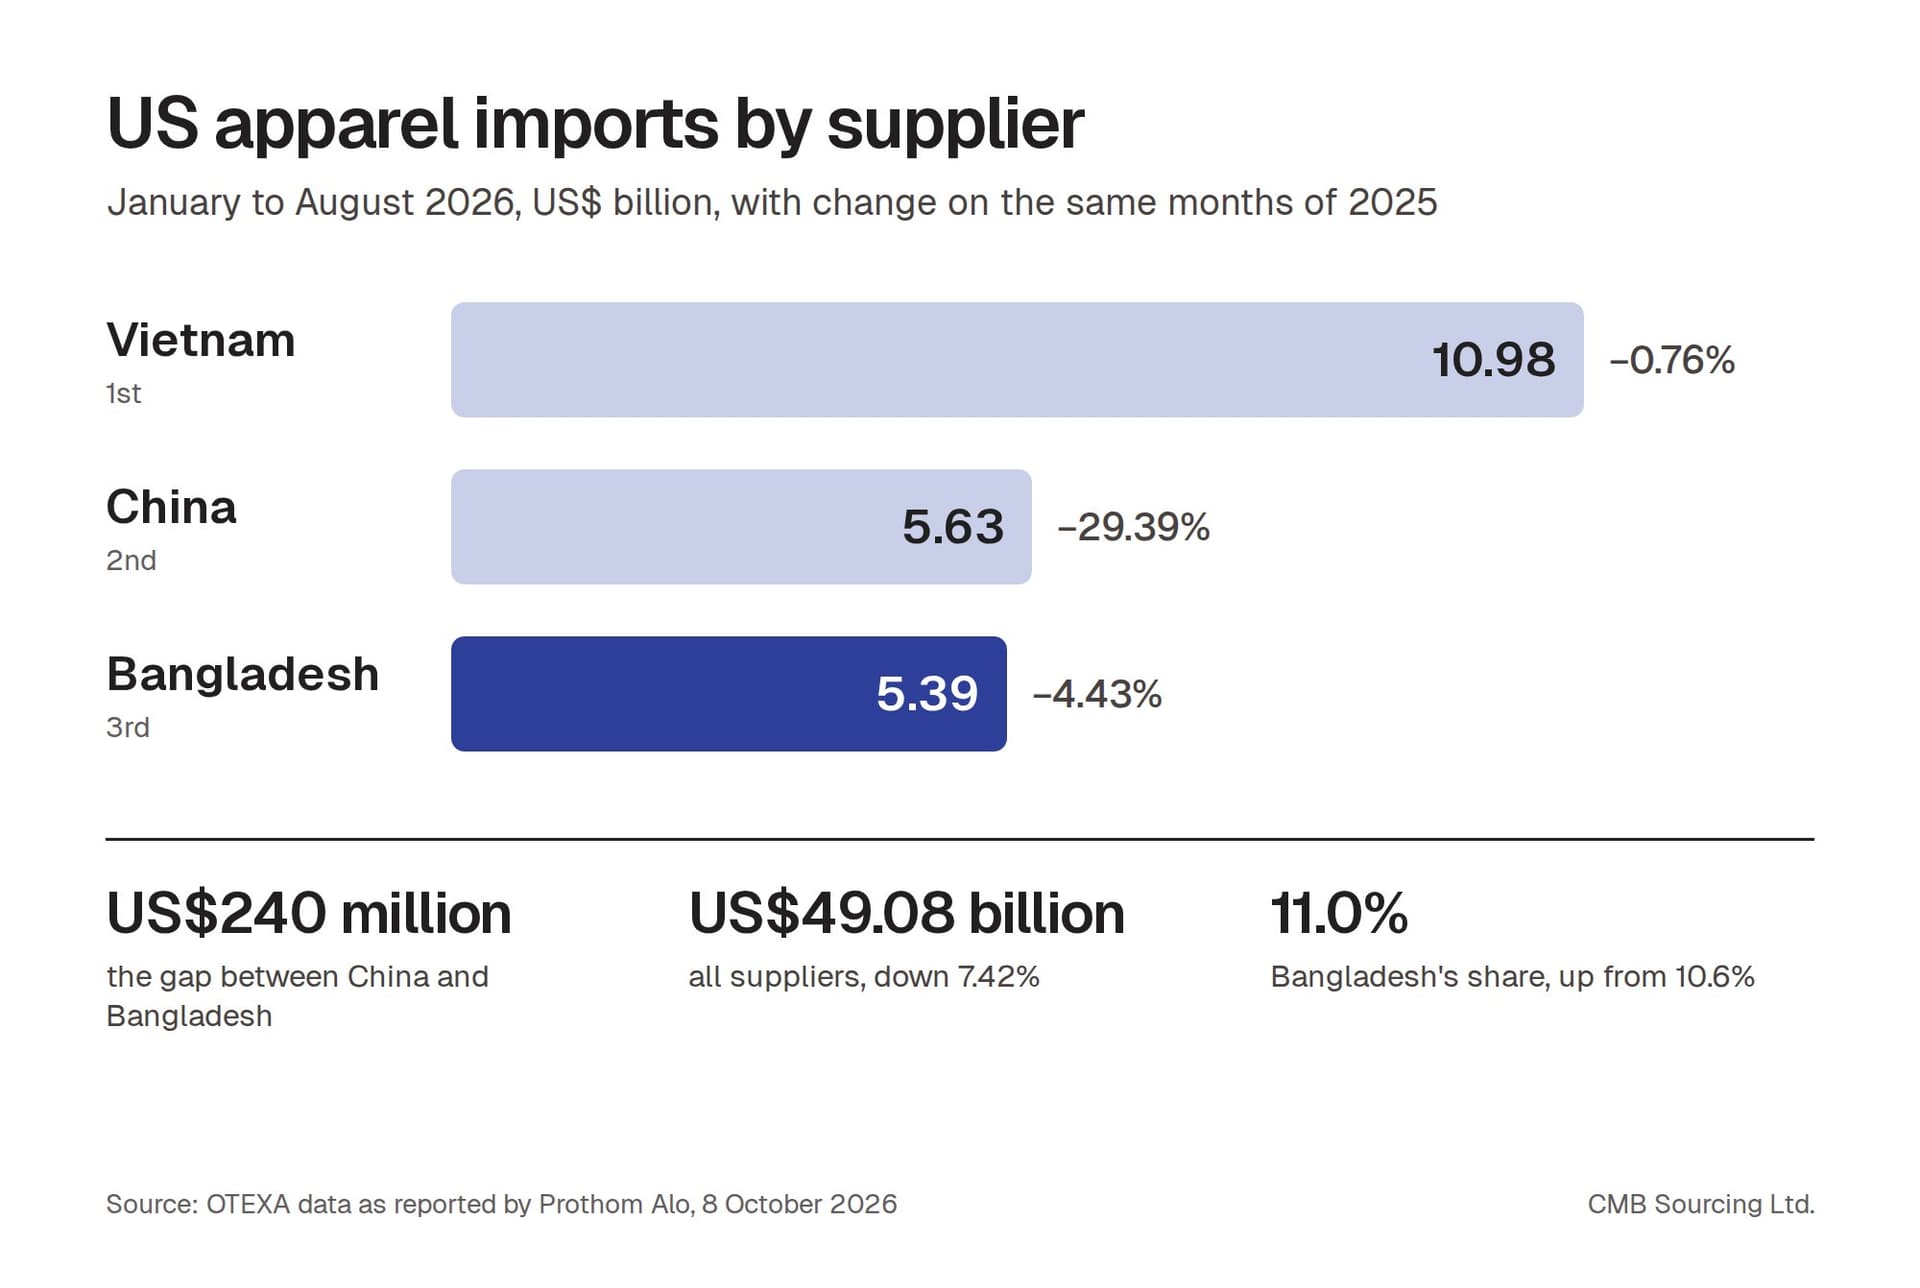
US apparel imports by country, January to August 2026
| Supplier | Value | Change on 2025 | Share of US clothing imports |
|---|---|---|---|
| Vietnam | US$10.98 billion | -0.76% | 22.4% |
| China | US$5.63 billion | -29.39% | 11.5% |
| Bangladesh | US$5.39 billion | -4.43% | 11.0% |
| India | Not reported | -26.44% | Not reported |
| Pakistan | Not reported | -3.83% | Not reported |
| Indonesia | Not reported | +2.58% | Not reported |
| Cambodia | Not reported | +6.91% | Not reported |
| All suppliers | US$49.08 billion | -7.42% | 100% |
The shares are our own calculation: each country’s value divided by the US$49.08 billion total. Everything else in the table is as reported.3
Is Bangladesh’s garment (RMG) industry losing ground in the US?
Less than the headline suggests. Three facts sit behind the ranking.
- The whole market shrank. The US bought 7.42% less clothing by value and 8.98% less by volume than in the same months of 2025.4
- Bangladesh fell less than the market. Its sales dropped 4.43%, so its share of US clothing imports went up, not down.
- China is second after losing almost a third of its sales. It was far ahead to begin with. A year earlier the gap between the two countries was much wider.
So Bangladesh lost a place in the table while gaining market share. Both statements are true, and the second one matters more to anyone choosing where to place an order.
How did China move back ahead in one month?
The ranking uses running totals for the year. Bangladesh was ahead at the end of July and US$240 million behind at the end of August, so China’s clothing arrivals in the US in August were larger than Bangladesh’s by more than that gap. The reports we read do not give a reason for the August swing, and we will not guess at one.
A margin this small can reverse. Bangladesh’s Export Promotion Bureau recorded US$817 million of garment exports to the US in August 2026, up 25.65% on August 2025.5 Those are goods leaving Bangladesh; OTEXA counts goods arriving in the US, which happens some weeks later. Strong August shipments may therefore show up in the US figures for September and October.
Why Bangladesh and China are not selling the same clothes
Price per unit shows that the two countries supply different parts of the market.
| Supplier | Price per square metre | Change on 2025 |
|---|---|---|
| Vietnam | US$3.54 | -0.58% |
| Bangladesh | US$3.07 | -1.73% |
| Pakistan | US$2.78 | Not reported |
| China | US$1.47 | -9.93% |
US customs data measures clothing in square metres of fabric so that different garments can be added together. On that measure Bangladesh’s average price is about twice China’s, and Bangladesh shipped 1.76 billion square metres, about 3% less than a year earlier.6 China’s average price fell almost 10%, which means it is holding its place with cheaper goods.
Our comparison of Bangladesh, Vietnam, China and India for clothing manufacturing sets out what each country makes well.
Comparing Bangladesh with another country?
Send us the same tech pack you send elsewhere. Our costing states the shipping term, so you can compare like with like.
What US duty does clothing from Bangladesh pay compared with China and Vietnam?
Since 24 July 2026, clothing made in Bangladesh pays the normal US duty for its tariff line plus a 10% tariff under Section 301. Under the same action, goods from China and Vietnam pay 12.5%, and goods from India, Pakistan, Indonesia and Cambodia pay 10%.7 The normal duty depends on the garment, not the country, so on the same T-shirt Bangladesh pays 2.5 points less than Vietnam.
A former director of the garment exporters’ association told The Business Standard that this tariff position helps explain why Bangladesh has held up better than China.8 Our guide to US tariffs on clothing from Bangladesh gives the rate for each main garment and explains how it has changed since April 2025.
Where Bangladesh is weaker
The ranking is not the only signal. A World Bank report covered by The Daily Star on 7 October 2026 looked at January to June 2026: US clothing imports from Bangladesh fell 5.3%, while imports from Vietnam, Indonesia and Cambodia rose 3.0%, 3.6% and 11.6%. The report’s conclusion is that low cost is no longer enough, and that US buyers now weigh speed, flexibility, minimum order sizes and compliance as well.9
An exporter quoted by The Business Standard made the same point from the factory side: Bangladesh competes well with India and Pakistan, but trails Vietnam on lead times and on access to raw materials.10
What does this mean if you source apparel for the US market?
- Do not read the ranking as a quality or risk signal. It moved because of one month’s arrivals in a market that is down overall.
- Compare landed cost, not factory price. Duty differs by country and by fabric. Our landed cost calculator works it through for your garment.
- Ask about lead time early. It is the weakness the reports name. Bangladesh is strongest on cotton knits, denim and woven basics, where fabric is made locally.
- Plan for fewer, more accurate orders. US buyers are importing less. A supplier that will confirm quantities and dates in writing is worth more than a cheaper quote.
For the full process, see our guide to importing clothes from Bangladesh and the page for brands selling in the United States.
What to watch next
OTEXA publishes each month’s figures about five to six weeks after the month ends. The January to September numbers, due in November 2026, will show whether Bangladesh’s strong August shipments were enough to take second place back. We will update this page when they are published. Longer-run figures are in our Bangladesh garment export statistics.
CMB Sourcing Ltd. is a buying house in Narayanganj, Dhaka. We do not run sewing lines ourselves; we place each order in our sister factory or an audited partner factory and name the factory to you in writing before production starts.
Notes
- Staff Correspondent, “Bangladesh Loses Second Place in Garment Exports to the US,” Prothom Alo English, October 8, 2026.
- Staff Correspondent, “Bangladesh Loses Second Place.”
- Staff Correspondent, “Bangladesh Loses Second Place”; Shoumik Ahmmed Anik, “Bangladesh Weathers US Apparel Import Downturn Better Than Peers,” The Business Standard, October 7, 2026.
- Staff Correspondent, “Bangladesh Loses Second Place.”
- Anik, “Bangladesh Weathers US Apparel Import Downturn,” citing Export Promotion Bureau data.
- Staff Correspondent, “Bangladesh Loses Second Place.”
- Office of the United States Trade Representative, “Notice of Actions in Section 301 Investigations of Acts, Policies, and Practices of Various Economies,” Federal Register, July 28, 2026.
- Anik, “Bangladesh Weathers US Apparel Import Downturn.”
- Star Business Report, “Low Costs No Longer Enough: Apparel Loses Ground in US,” The Daily Star, October 7, 2026.
- Anik, “Bangladesh Weathers US Apparel Import Downturn.”
- FE Report, “Bangladesh Beats China to Book Second Slot,” The Financial Express, May 11, 2026.
Questions buyers ask.
Is Bangladesh still the second-largest apparel supplier to the US?
Not on the latest figures. US Office of Textiles and Apparel data for January to August 2026, reported by Prothom Alo on 8 October 2026, ranks Vietnam first with US$10.98 billion, China second with US$5.63 billion and Bangladesh third with US$5.39 billion. Bangladesh had been second at the end of July. The difference between China and Bangladesh is US$240 million, which is small enough to reverse within a month or two. Bangladesh remains the world’s second-largest clothing exporter overall, a different measure that counts sales to every country, not only the United States. The US ranking is updated monthly, so check the date on any figure you read.
Why did China overtake Bangladesh in US apparel imports?
The ranking is a running total for the year. Bangladesh was ahead at the end of July and US$240 million behind at the end of August, so China’s clothing arrivals in the US during August exceeded Bangladesh’s by more than that gap. The reports do not give a cause for the August swing. It did not happen because China is growing: its clothing exports to the US fell 29.39% in January to August 2026, against a fall of 4.43% for Bangladesh. China started from a much larger base, so it can lose almost a third of its sales and still be slightly ahead. Its average price also fell about 10%, to US$1.47 per square metre, less than half of Bangladesh’s US$3.07.
Are US clothing imports from Bangladesh going up or down?
Down a little by value, and up as a share. In January to August 2026 the US imported US$5.39 billion of clothing from Bangladesh, 4.43% less than in the same months of 2025, and about 3% less by volume. Total US clothing imports fell faster, by 7.42%, so Bangladesh’s share of the market rose to about 11%, by our calculation from the reported figures. More recent shipment data points up: Bangladesh’s Export Promotion Bureau recorded US$817 million of garment exports to the US in August 2026, 25.65% more than in August 2025, as reported by The Business Standard. Those goods reach the US import figures some weeks later.
Does clothing from Bangladesh pay less US duty than clothing from China or Vietnam?
On the additional tariff, yes. Since 24 July 2026 the United States charges a Section 301 tariff of 10% on goods from Bangladesh and 12.5% on goods from China and Vietnam, on top of the normal duty for the garment’s tariff line. The normal duty is the same whichever country made the garment, for example 16.5% on a cotton T-shirt, so the difference between Bangladesh and Vietnam is 2.5 percentage points on every line. India, Pakistan, Indonesia and Cambodia pay the same 10% as Bangladesh. Duty is charged on the price paid to the factory, not the retail price. Rates have changed several times since April 2025, so confirm the rate on the date your goods will enter the US.
Sources
Checked . Rules and figures change, so confirm anything that affects your pricing.
- Anik, Shoumik Ahmmed. “Bangladesh Weathers US Apparel Import Downturn Better Than Peers.” The Business Standard, October 7, 2026. (opens in a new tab)
- FE Report. “Bangladesh Beats China to Book Second Slot.” The Financial Express, May 11, 2026. (opens in a new tab)
- Office of Textiles and Apparel. “OTEXA Trade Data.” U.S. Department of Commerce, International Trade Administration. Accessed October 13, 2026. (The origin of the import figures; we read them as reported by the newspapers listed here.) (opens in a new tab)
- Office of the United States Trade Representative. “Notice of Actions in Section 301 Investigations of Acts, Policies, and Practices of Various Economies.” Federal Register, July 28, 2026. (opens in a new tab)
- Staff Correspondent. “Bangladesh Loses Second Place in Garment Exports to the US.” Prothom Alo English, October 8, 2026. (opens in a new tab)
- Star Business Report. “Low Costs No Longer Enough: Apparel Loses Ground in US.” The Daily Star, October 7, 2026. (opens in a new tab)